| __timestamp | Textron Inc. | Watsco, Inc. |
|---|---|---|
| Wednesday, January 1, 2014 | 2457000000 | 956402000 |
| Thursday, January 1, 2015 | 2444000000 | 1007357000 |
| Friday, January 1, 2016 | 2477000000 | 1034584000 |
| Sunday, January 1, 2017 | 2403000000 | 1065659000 |
| Monday, January 1, 2018 | 2378000000 | 1120252000 |
| Tuesday, January 1, 2019 | 2224000000 | 1156956000 |
| Wednesday, January 1, 2020 | 1557000000 | 1222821000 |
| Friday, January 1, 2021 | 2085000000 | 1667545000 |
| Saturday, January 1, 2022 | 2069000000 | 2030289000 |
| Sunday, January 1, 2023 | 2278000000 | 1992140000 |
| Monday, January 1, 2024 | 2502000000 | 2044713000 |
Unlocking the unknown
In the competitive landscape of American industry, Watsco, Inc. and Textron Inc. have carved out significant niches. From 2014 to 2023, Textron Inc. consistently outperformed Watsco, Inc. in terms of gross profit, with Textron's figures peaking in 2024 at an impressive 1,370% of its 2014 value. However, Watsco, Inc. demonstrated remarkable growth, especially between 2020 and 2022, where its gross profit surged by approximately 66%. This period marked a pivotal moment for Watsco, as it nearly matched Textron's performance in 2022. The data reveals a fascinating narrative of resilience and growth, with Watsco closing the gap significantly over the years. As we look to the future, the absence of Watsco's 2024 data leaves us eagerly anticipating whether it will continue its upward trajectory or if Textron will maintain its lead.
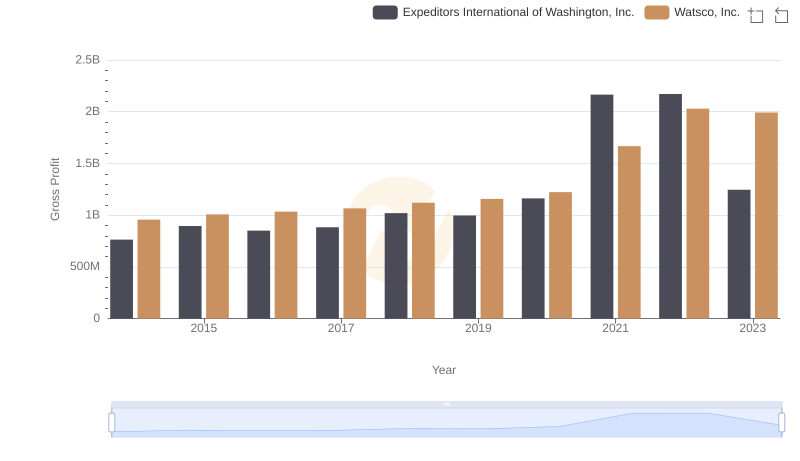
Gross Profit Trends Compared: Watsco, Inc. vs Expeditors International of Washington, Inc.
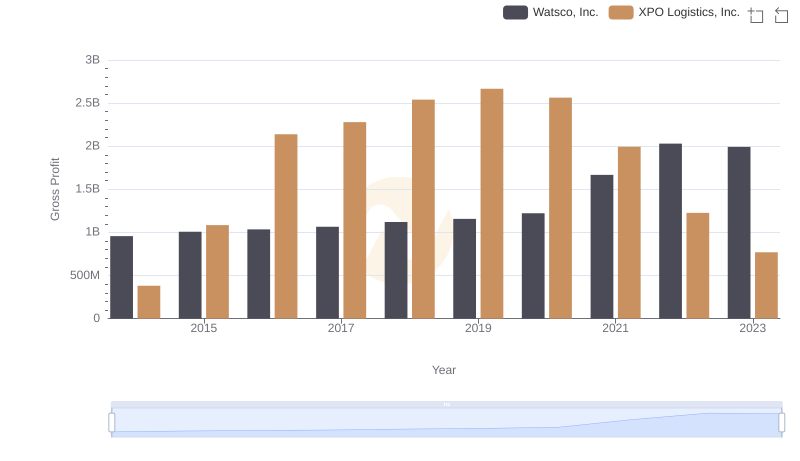
Watsco, Inc. vs XPO Logistics, Inc.: A Gross Profit Performance Breakdown
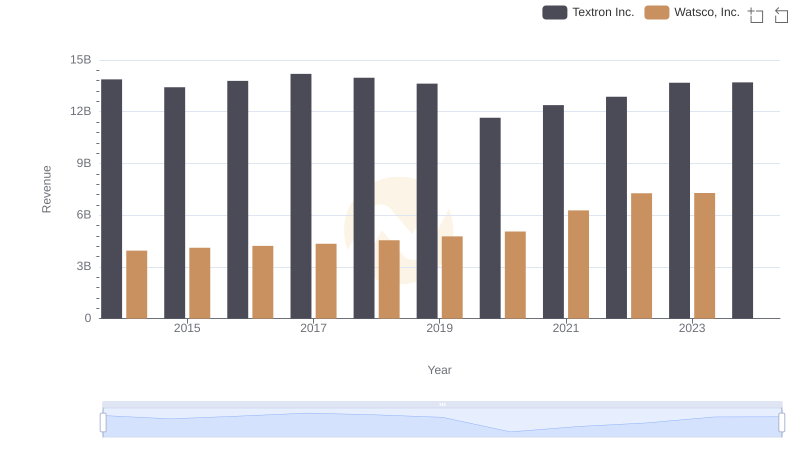
Breaking Down Revenue Trends: Watsco, Inc. vs Textron Inc.
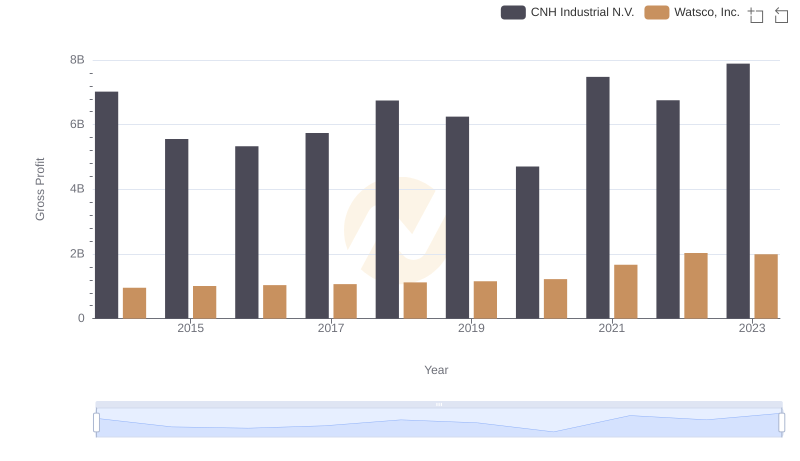
Watsco, Inc. vs CNH Industrial N.V.: A Gross Profit Performance Breakdown
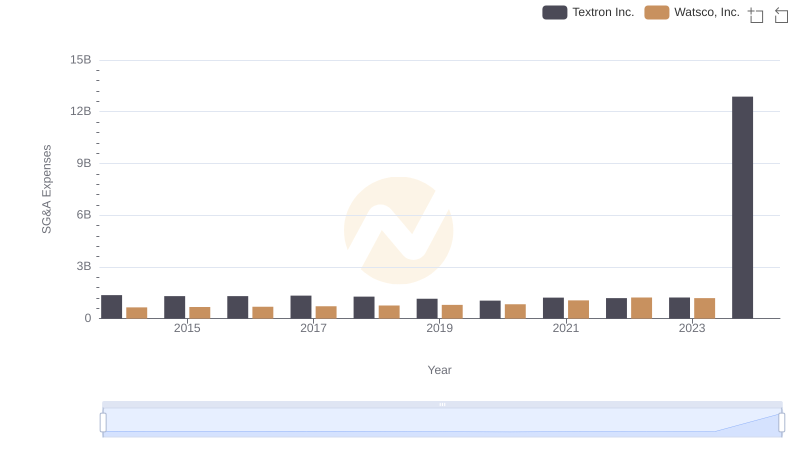
Operational Costs Compared: SG&A Analysis of Watsco, Inc. and Textron Inc.
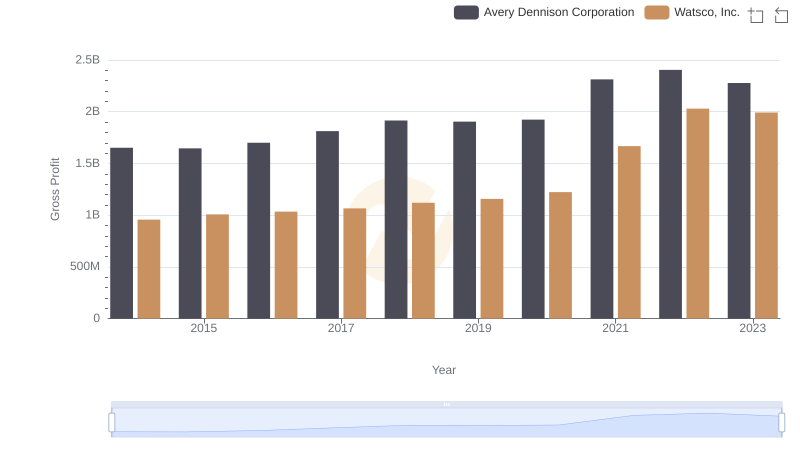
Gross Profit Comparison: Watsco, Inc. and Avery Dennison Corporation Trends
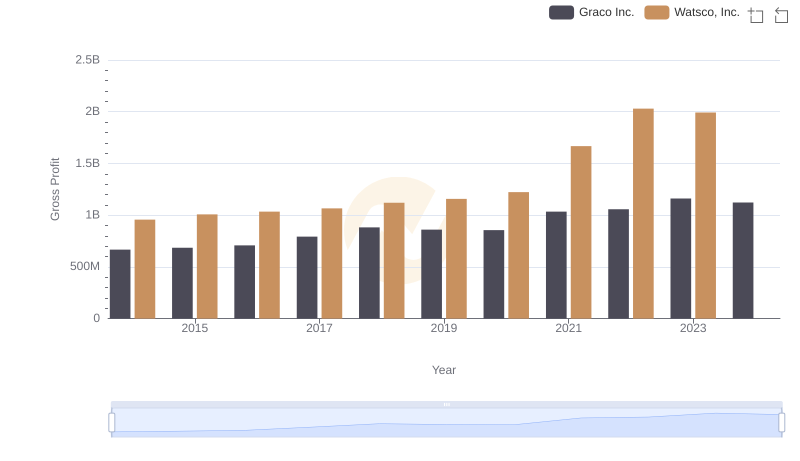
Who Generates Higher Gross Profit? Watsco, Inc. or Graco Inc.
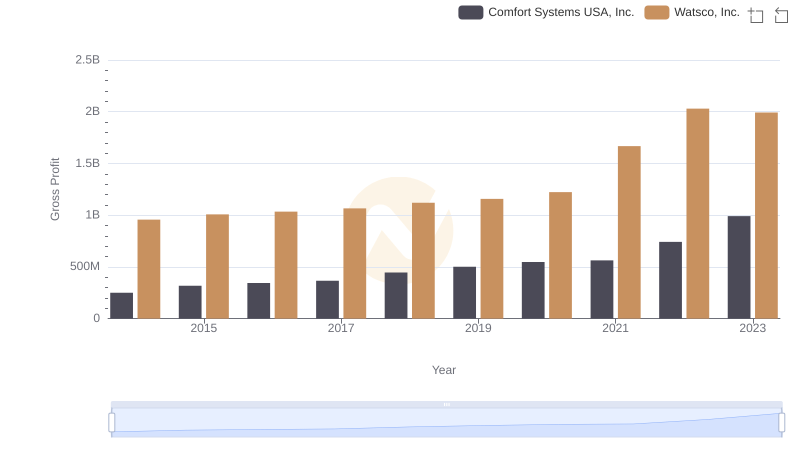
Gross Profit Comparison: Watsco, Inc. and Comfort Systems USA, Inc. Trends
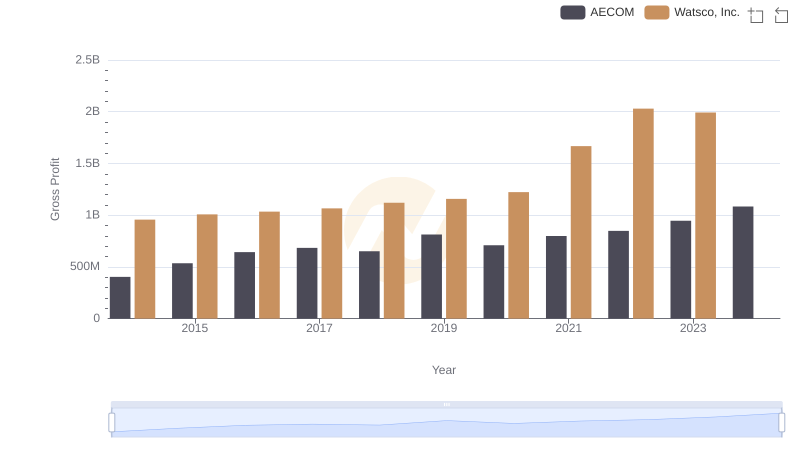
Who Generates Higher Gross Profit? Watsco, Inc. or AECOM
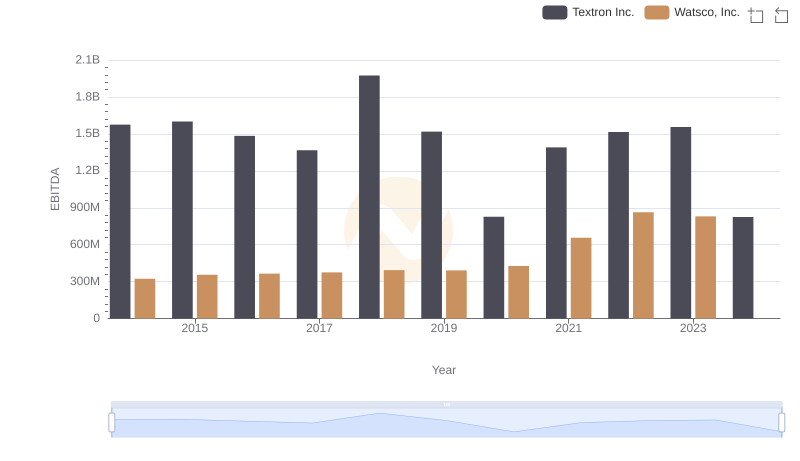
A Side-by-Side Analysis of EBITDA: Watsco, Inc. and Textron Inc.
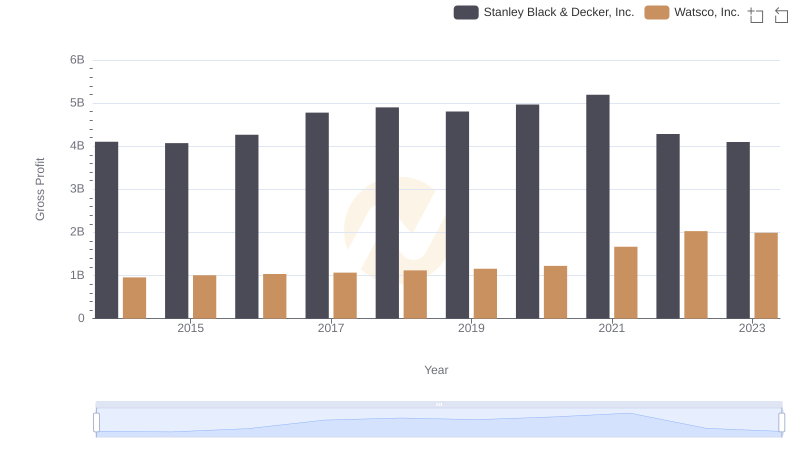
Gross Profit Trends Compared: Watsco, Inc. vs Stanley Black & Decker, Inc.