| __timestamp | Textron Inc. | Watsco, Inc. |
|---|---|---|
| Wednesday, January 1, 2014 | 1575000000 | 323674000 |
| Thursday, January 1, 2015 | 1601000000 | 355865000 |
| Friday, January 1, 2016 | 1484000000 | 365698000 |
| Sunday, January 1, 2017 | 1367000000 | 375907000 |
| Monday, January 1, 2018 | 1974000000 | 394177000 |
| Tuesday, January 1, 2019 | 1518000000 | 391396000 |
| Wednesday, January 1, 2020 | 827000000 | 426942000 |
| Friday, January 1, 2021 | 1391000000 | 656655000 |
| Saturday, January 1, 2022 | 1515000000 | 863261000 |
| Sunday, January 1, 2023 | 1556000000 | 829900000 |
| Monday, January 1, 2024 | 1422000000 | 781775000 |
Unveiling the hidden dimensions of data
In the ever-evolving landscape of American industry, Watsco, Inc. and Textron Inc. stand as titans in their respective fields. Over the past decade, from 2014 to 2023, these companies have showcased distinct financial trajectories, particularly in their EBITDA performance. Textron Inc., a leader in aerospace and defense, has consistently outperformed Watsco, Inc., a major player in HVAC distribution, with an average EBITDA nearly three times higher. Notably, Textron's EBITDA peaked in 2018, reaching a remarkable 1.97 billion, while Watsco's highest was in 2022, with 863 million. However, the data for 2024 reveals a gap, with Watsco's figures missing, leaving room for speculation. This analysis not only highlights the financial prowess of these corporations but also underscores the dynamic nature of their industries, offering valuable insights for investors and market analysts alike.
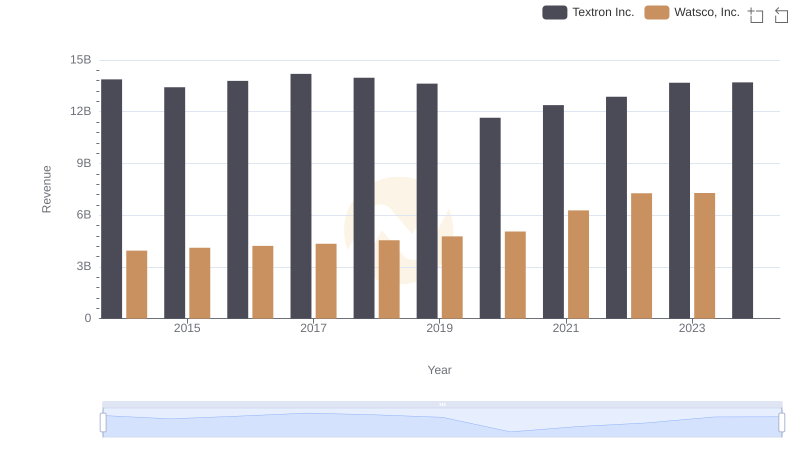
Breaking Down Revenue Trends: Watsco, Inc. vs Textron Inc.
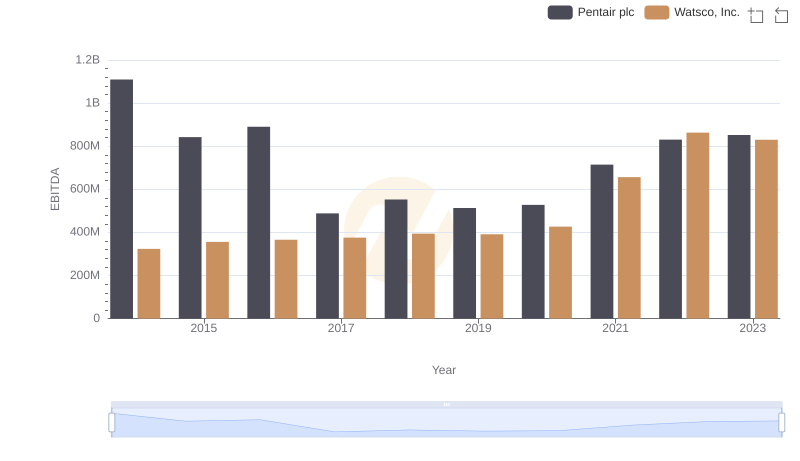
EBITDA Performance Review: Watsco, Inc. vs Pentair plc
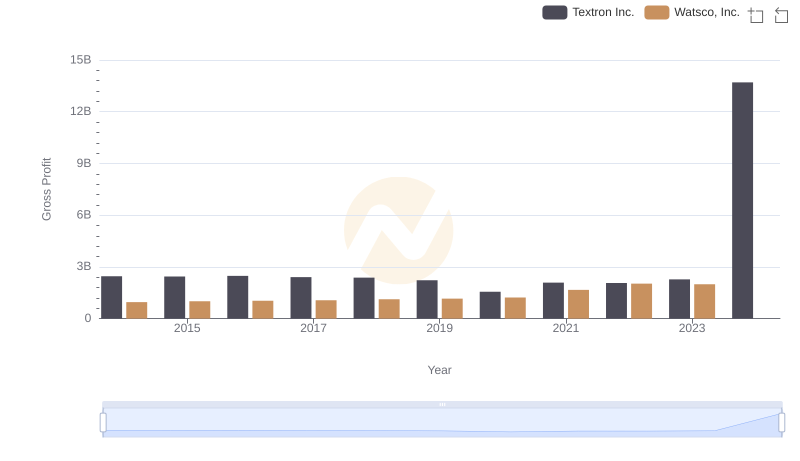
Watsco, Inc. vs Textron Inc.: A Gross Profit Performance Breakdown
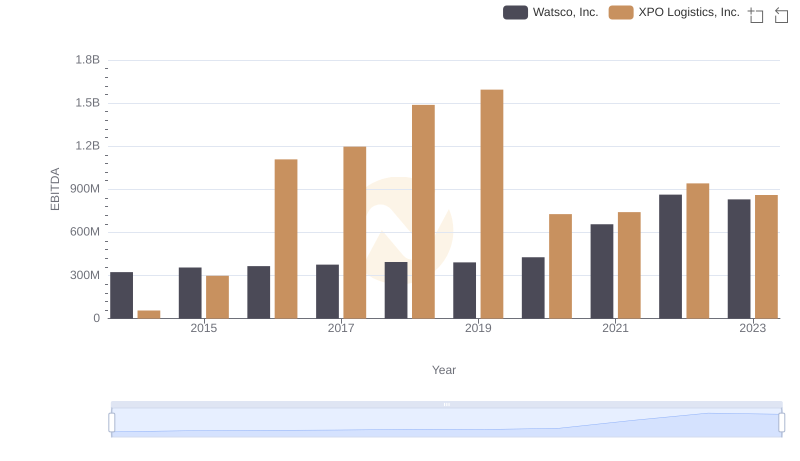
Comparative EBITDA Analysis: Watsco, Inc. vs XPO Logistics, Inc.
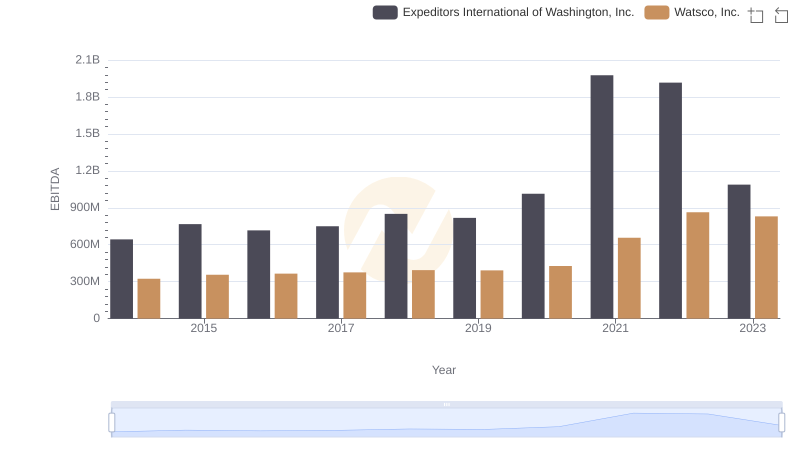
Comprehensive EBITDA Comparison: Watsco, Inc. vs Expeditors International of Washington, Inc.
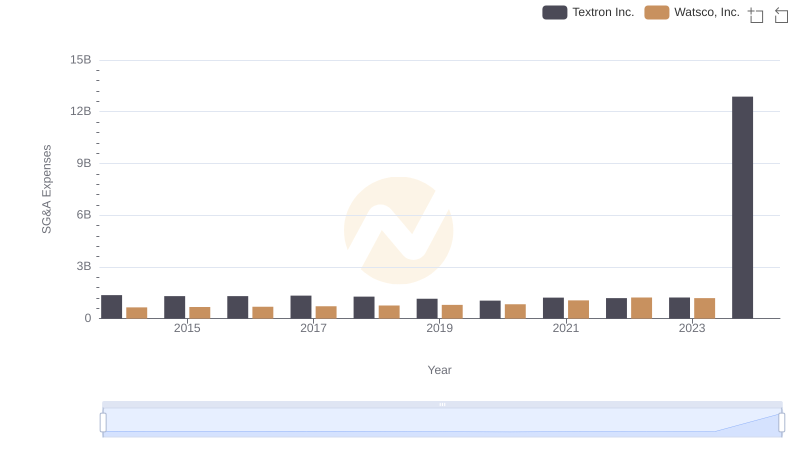
Operational Costs Compared: SG&A Analysis of Watsco, Inc. and Textron Inc.
Professional EBITDA Benchmarking: Watsco, Inc. vs CNH Industrial N.V.
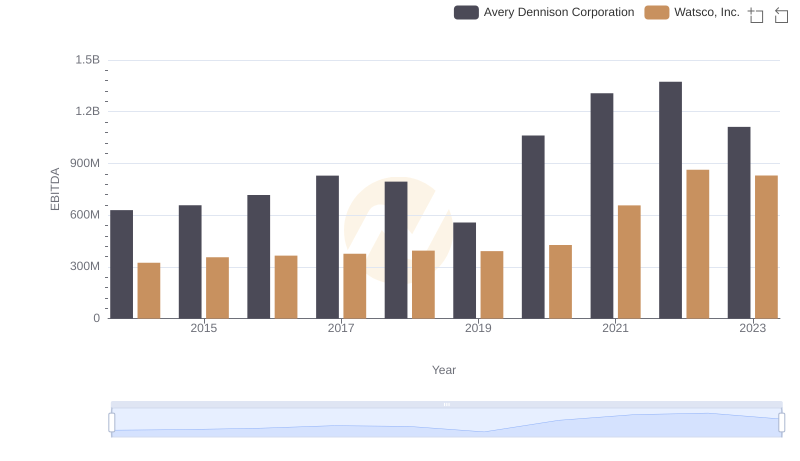
A Professional Review of EBITDA: Watsco, Inc. Compared to Avery Dennison Corporation
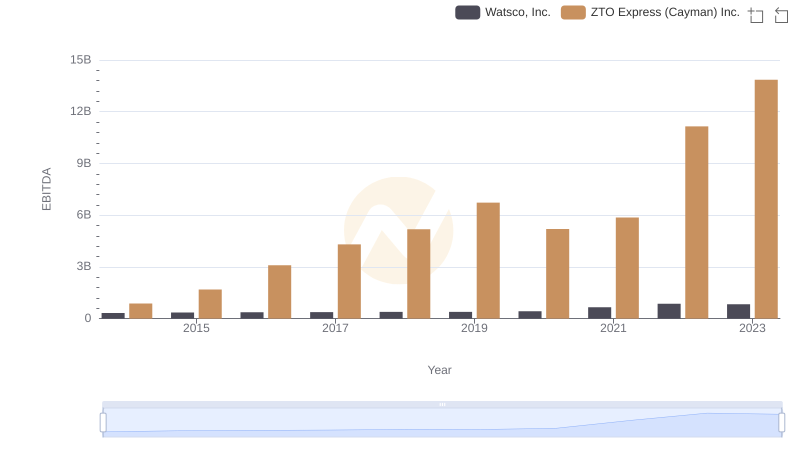
A Side-by-Side Analysis of EBITDA: Watsco, Inc. and ZTO Express (Cayman) Inc.
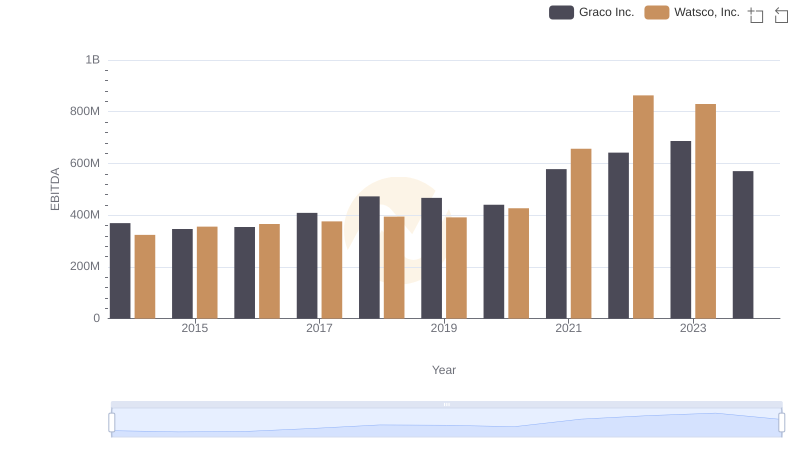
Watsco, Inc. vs Graco Inc.: In-Depth EBITDA Performance Comparison
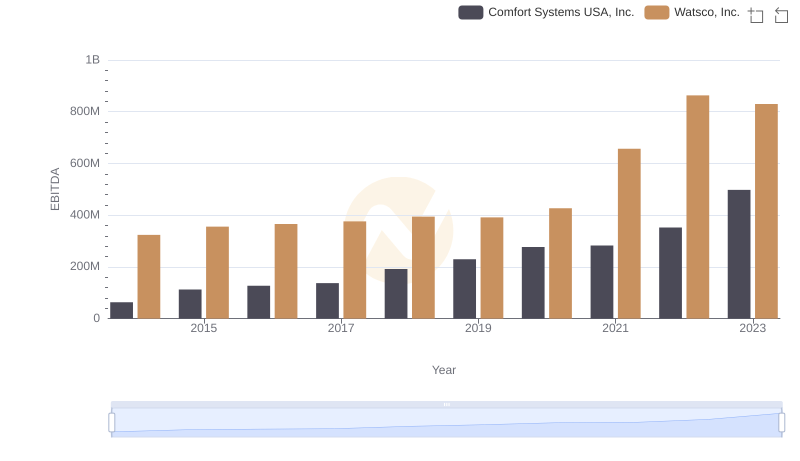
Comparative EBITDA Analysis: Watsco, Inc. vs Comfort Systems USA, Inc.