| __timestamp | Avery Dennison Corporation | Watsco, Inc. |
|---|---|---|
| Wednesday, January 1, 2014 | 1651200000 | 956402000 |
| Thursday, January 1, 2015 | 1645800000 | 1007357000 |
| Friday, January 1, 2016 | 1699700000 | 1034584000 |
| Sunday, January 1, 2017 | 1812200000 | 1065659000 |
| Monday, January 1, 2018 | 1915500000 | 1120252000 |
| Tuesday, January 1, 2019 | 1904100000 | 1156956000 |
| Wednesday, January 1, 2020 | 1923300000 | 1222821000 |
| Friday, January 1, 2021 | 2312800000 | 1667545000 |
| Saturday, January 1, 2022 | 2404200000 | 2030289000 |
| Sunday, January 1, 2023 | 2277499999 | 1992140000 |
| Monday, January 1, 2024 | 2530700000 | 2044713000 |
Unveiling the hidden dimensions of data
In the ever-evolving landscape of industrial giants, Watsco, Inc. and Avery Dennison Corporation have carved out significant niches. Over the past decade, from 2014 to 2023, these companies have demonstrated remarkable growth in gross profit, reflecting their resilience and strategic prowess.
Avery Dennison has shown a consistent upward trajectory, with gross profits increasing by approximately 38% over the period. The company peaked in 2022, showcasing its ability to adapt and thrive in changing market conditions.
Watsco, Inc. has also experienced substantial growth, with a notable 112% increase in gross profit from 2014 to 2022. This growth underscores Watsco's strategic expansions and market penetration.
Both companies have demonstrated resilience, with Avery Dennison maintaining a steady lead, while Watsco's aggressive growth strategy has narrowed the gap significantly.
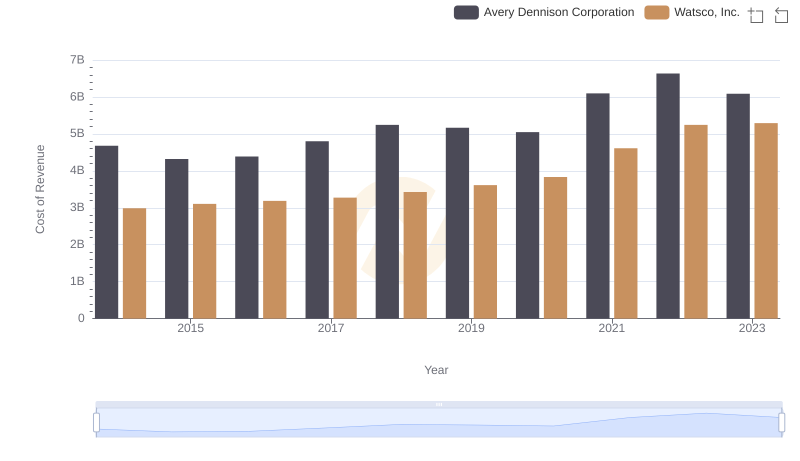
Cost of Revenue Comparison: Watsco, Inc. vs Avery Dennison Corporation
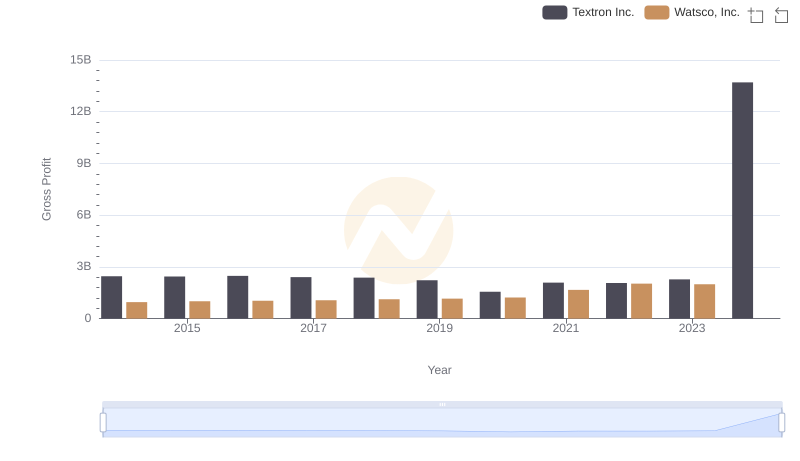
Watsco, Inc. vs Textron Inc.: A Gross Profit Performance Breakdown
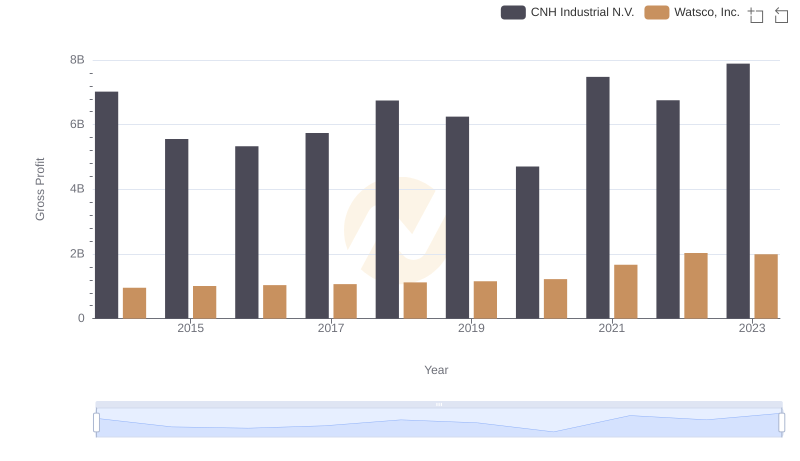
Watsco, Inc. vs CNH Industrial N.V.: A Gross Profit Performance Breakdown
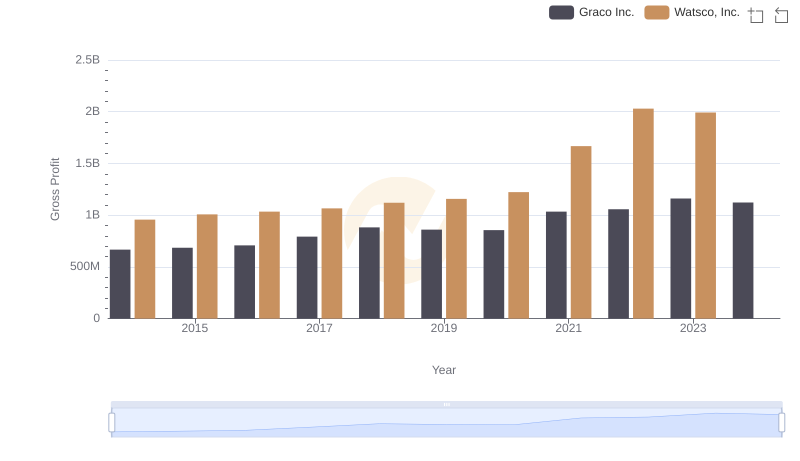
Who Generates Higher Gross Profit? Watsco, Inc. or Graco Inc.
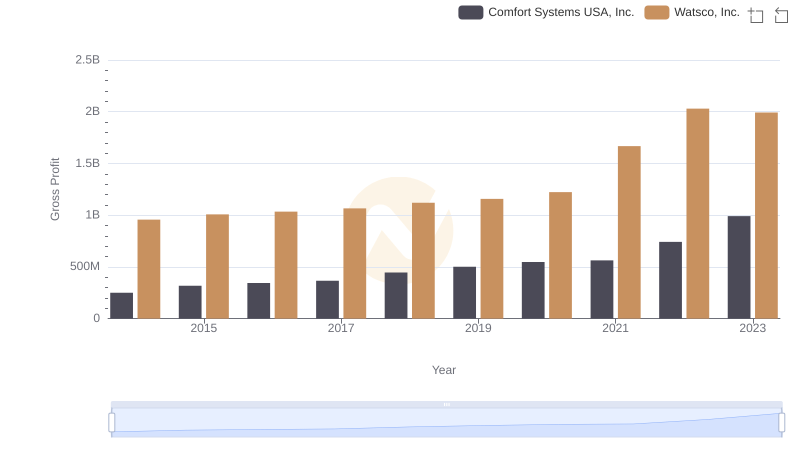
Gross Profit Comparison: Watsco, Inc. and Comfort Systems USA, Inc. Trends
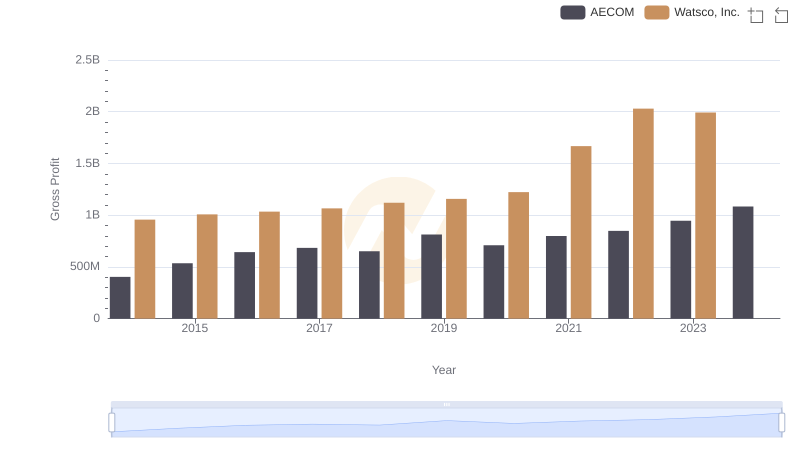
Who Generates Higher Gross Profit? Watsco, Inc. or AECOM
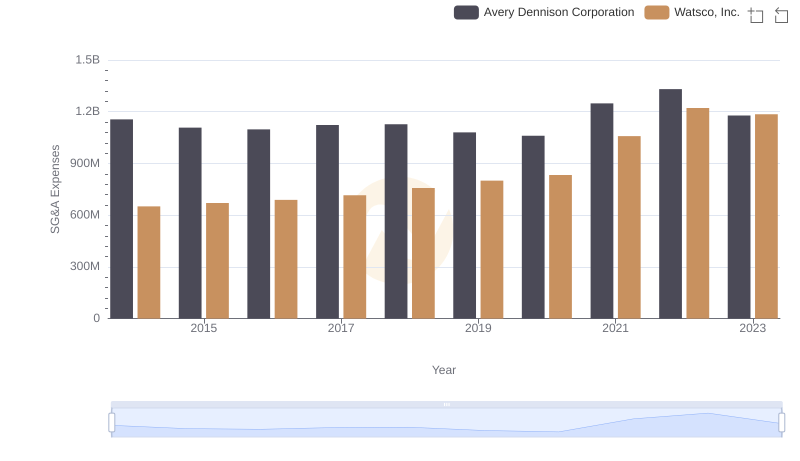
Watsco, Inc. and Avery Dennison Corporation: SG&A Spending Patterns Compared
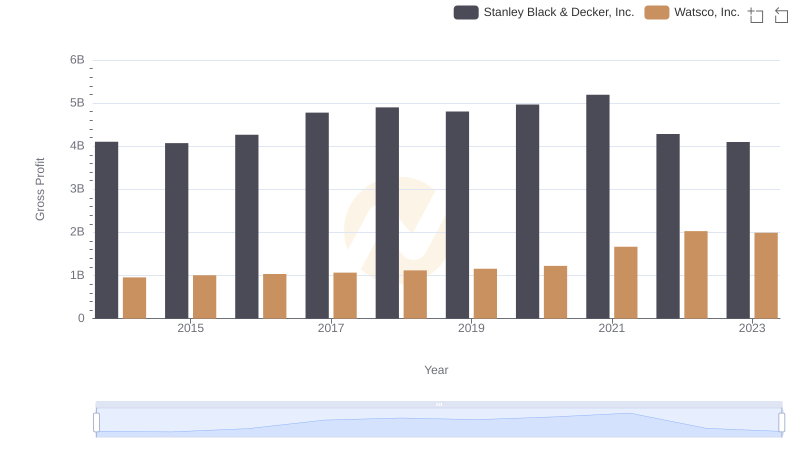
Gross Profit Trends Compared: Watsco, Inc. vs Stanley Black & Decker, Inc.
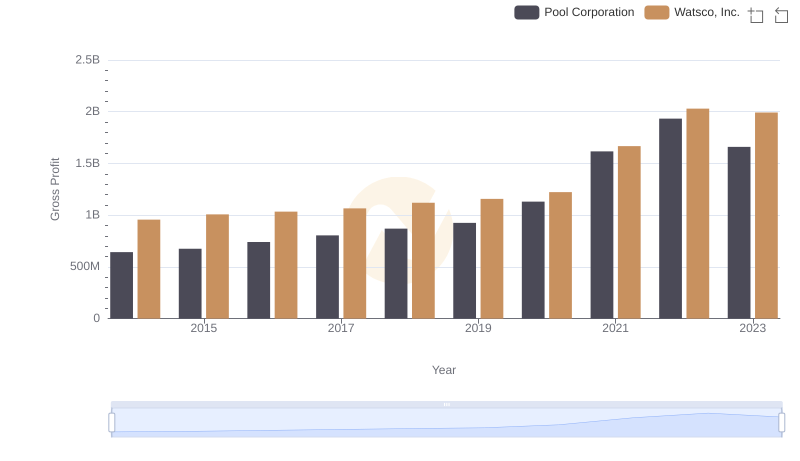
Watsco, Inc. and Pool Corporation: A Detailed Gross Profit Analysis
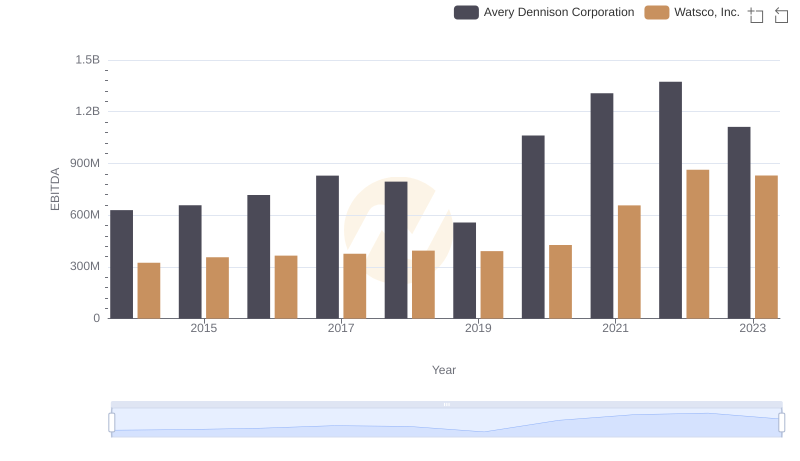
A Professional Review of EBITDA: Watsco, Inc. Compared to Avery Dennison Corporation