| __timestamp | Stanley Black & Decker, Inc. | Watsco, Inc. |
|---|---|---|
| Wednesday, January 1, 2014 | 4102700000 | 956402000 |
| Thursday, January 1, 2015 | 4072000000 | 1007357000 |
| Friday, January 1, 2016 | 4267200000 | 1034584000 |
| Sunday, January 1, 2017 | 4778000000 | 1065659000 |
| Monday, January 1, 2018 | 4901900000 | 1120252000 |
| Tuesday, January 1, 2019 | 4805500000 | 1156956000 |
| Wednesday, January 1, 2020 | 4967900000 | 1222821000 |
| Friday, January 1, 2021 | 5194200000 | 1667545000 |
| Saturday, January 1, 2022 | 4284100000 | 2030289000 |
| Sunday, January 1, 2023 | 4098000000 | 1992140000 |
| Monday, January 1, 2024 | 4514400000 | 2044713000 |
In pursuit of knowledge
In the ever-evolving landscape of industrial and consumer goods, Watsco, Inc. and Stanley Black & Decker, Inc. have carved out significant niches. Over the past decade, these companies have shown contrasting trends in their gross profit margins. From 2014 to 2023, Watsco, Inc. has seen a remarkable growth of over 100% in gross profit, peaking in 2022. This growth trajectory highlights Watsco's strategic market positioning and operational efficiency.
Conversely, Stanley Black & Decker, Inc. experienced a more volatile journey. Despite a peak in 2021, their gross profit saw a decline of approximately 21% by 2023. This fluctuation underscores the challenges faced by the company in adapting to market dynamics. As we delve into these trends, it becomes evident that strategic agility and market adaptability are key to sustaining growth in the competitive industrial sector.
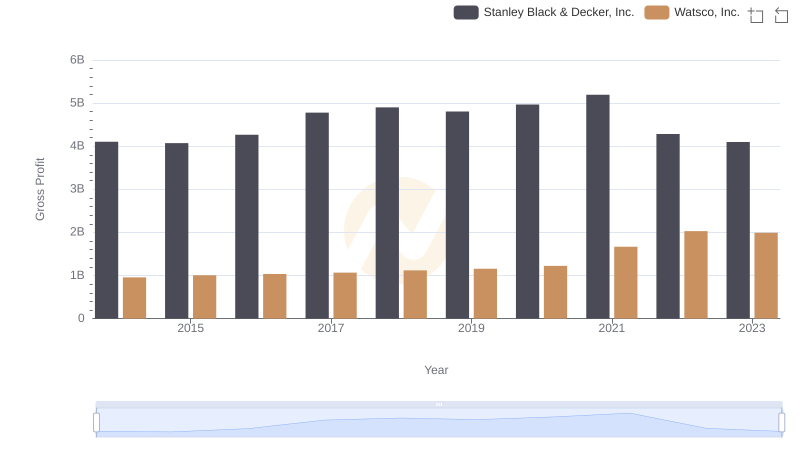
Key Insights on Gross Profit: Watsco, Inc. vs Stanley Black & Decker, Inc.
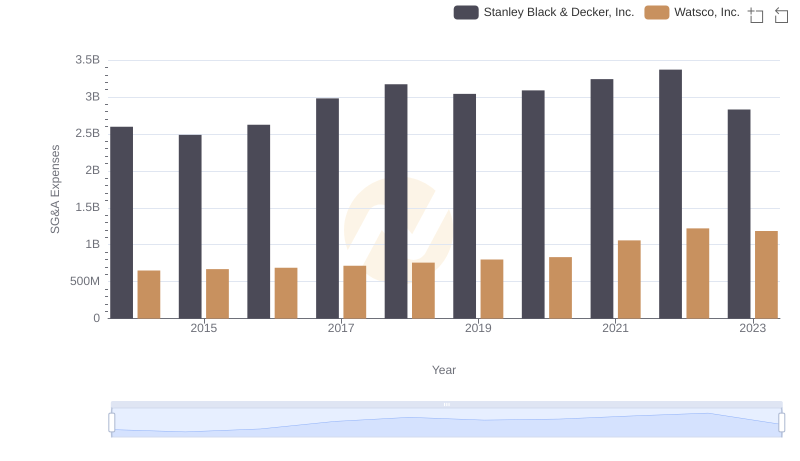
Breaking Down SG&A Expenses: Watsco, Inc. vs Stanley Black & Decker, Inc.
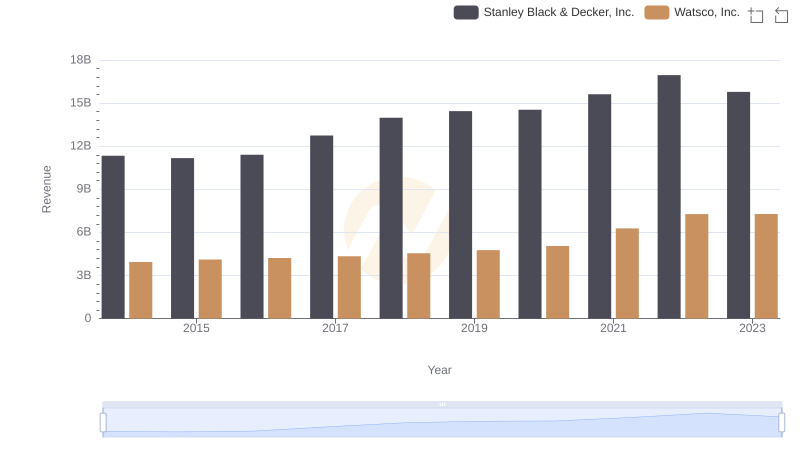
Who Generates More Revenue? Watsco, Inc. or Stanley Black & Decker, Inc.
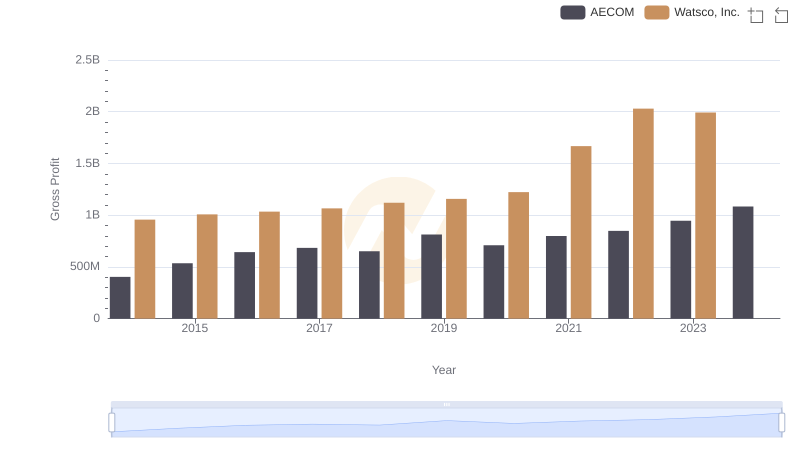
Who Generates Higher Gross Profit? Watsco, Inc. or AECOM
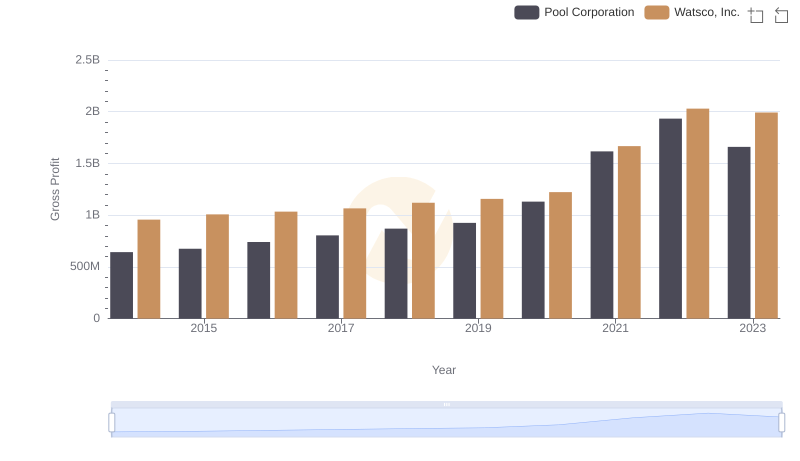
Watsco, Inc. and Pool Corporation: A Detailed Gross Profit Analysis

Cost Management Insights: SG&A Expenses for Watsco, Inc. and Stanley Black & Decker, Inc.
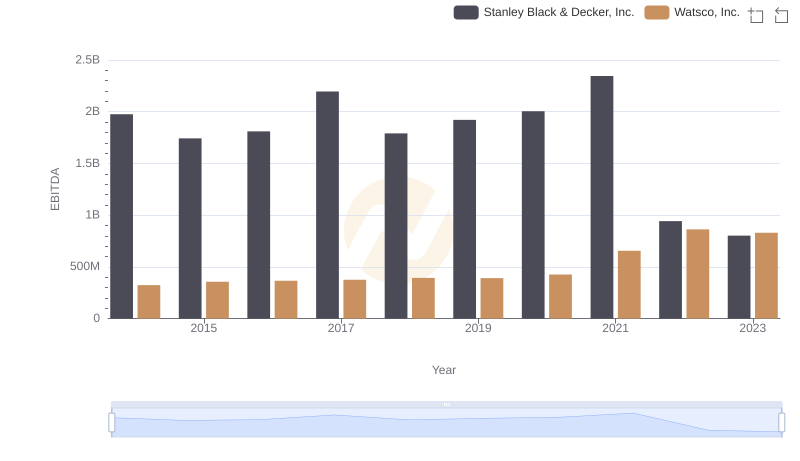
Comparative EBITDA Analysis: Watsco, Inc. vs Stanley Black & Decker, Inc.