| __timestamp | CNH Industrial N.V. | Watsco, Inc. |
|---|---|---|
| Wednesday, January 1, 2014 | 7021000000 | 956402000 |
| Thursday, January 1, 2015 | 5555000000 | 1007357000 |
| Friday, January 1, 2016 | 5333000000 | 1034584000 |
| Sunday, January 1, 2017 | 5740000000 | 1065659000 |
| Monday, January 1, 2018 | 6748000000 | 1120252000 |
| Tuesday, January 1, 2019 | 6247000000 | 1156956000 |
| Wednesday, January 1, 2020 | 4705000000 | 1222821000 |
| Friday, January 1, 2021 | 7477000000 | 1667545000 |
| Saturday, January 1, 2022 | 6754000000 | 2030289000 |
| Sunday, January 1, 2023 | 7889000000 | 1992140000 |
| Monday, January 1, 2024 | 2044713000 |
Cracking the code
In the competitive landscape of industrial and HVAC sectors, Watsco, Inc. and CNH Industrial N.V. have showcased intriguing trends in gross profit over the past decade. From 2014 to 2023, CNH Industrial N.V. consistently outperformed Watsco, Inc. in terms of gross profit, with an average of approximately 6.35 billion USD annually. However, Watsco, Inc. demonstrated a remarkable growth trajectory, increasing its gross profit by over 100% from 2014 to 2023.
This analysis underscores the dynamic nature of these industries and the strategic maneuvers by these companies to maintain and enhance their market positions.
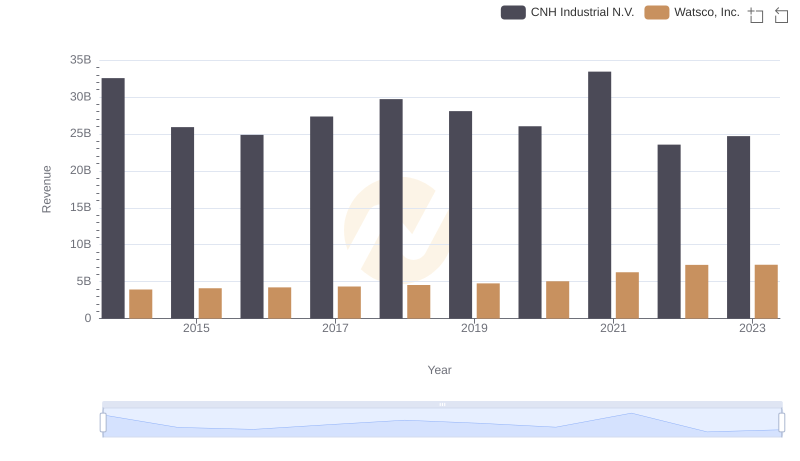
Comparing Revenue Performance: Watsco, Inc. or CNH Industrial N.V.?
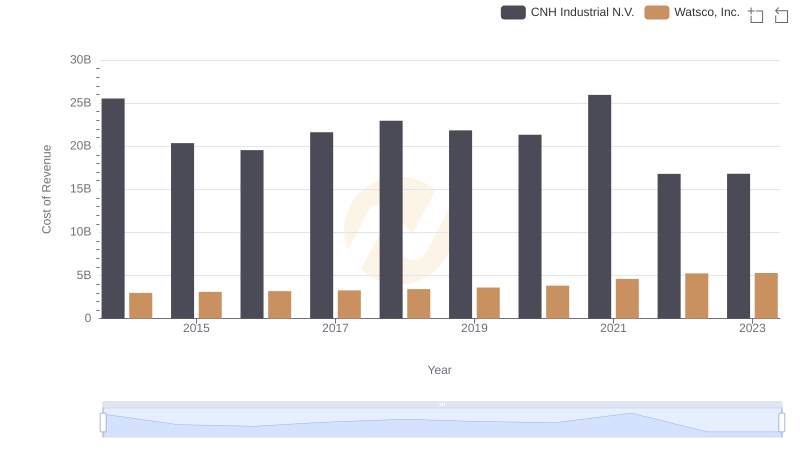
Watsco, Inc. vs CNH Industrial N.V.: Efficiency in Cost of Revenue Explored
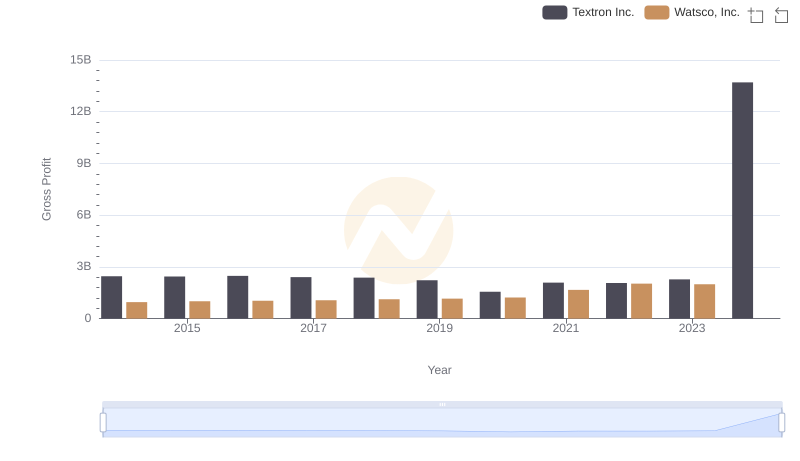
Watsco, Inc. vs Textron Inc.: A Gross Profit Performance Breakdown
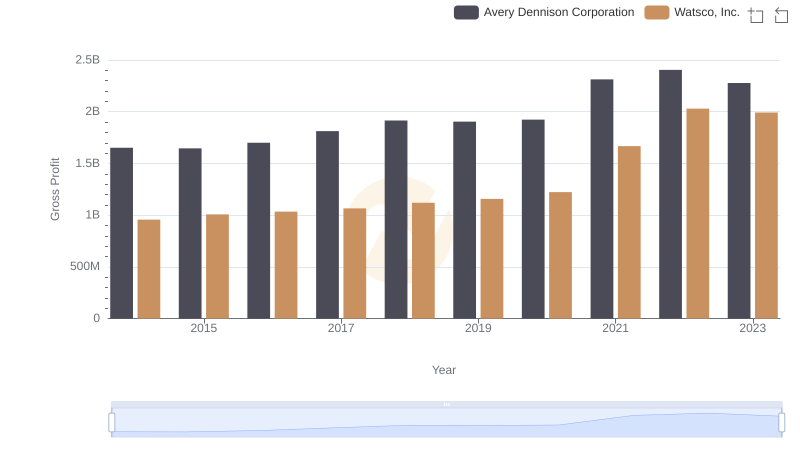
Gross Profit Comparison: Watsco, Inc. and Avery Dennison Corporation Trends
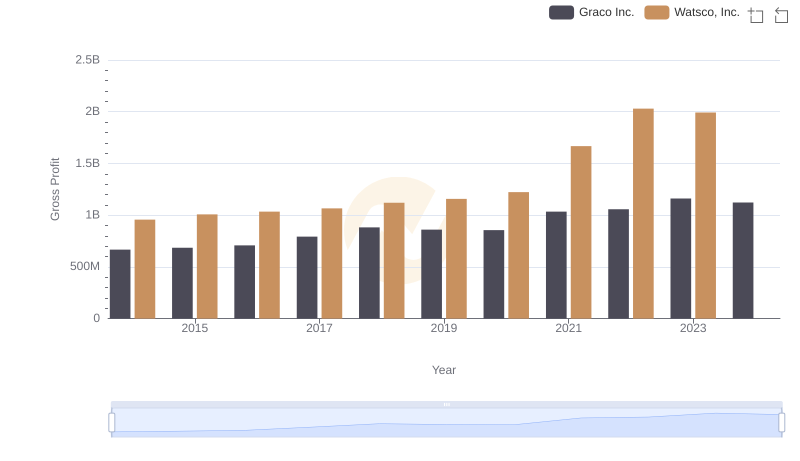
Who Generates Higher Gross Profit? Watsco, Inc. or Graco Inc.
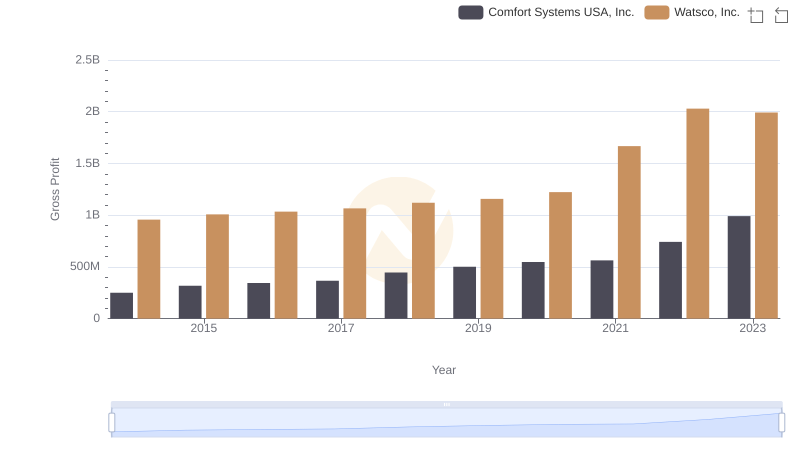
Gross Profit Comparison: Watsco, Inc. and Comfort Systems USA, Inc. Trends
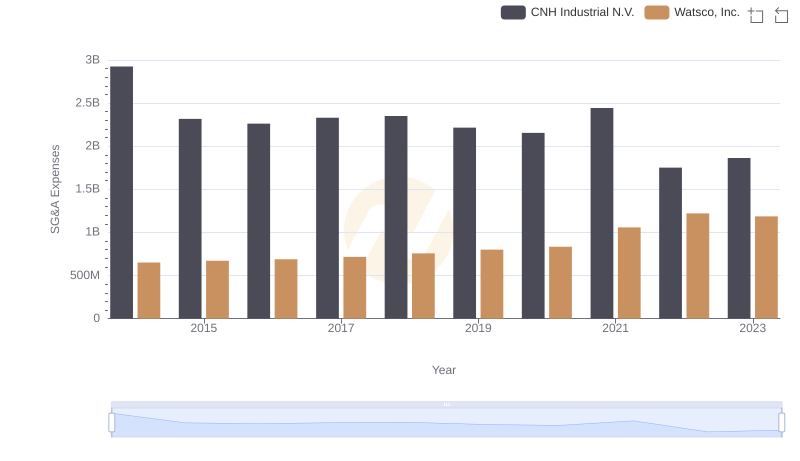
Selling, General, and Administrative Costs: Watsco, Inc. vs CNH Industrial N.V.
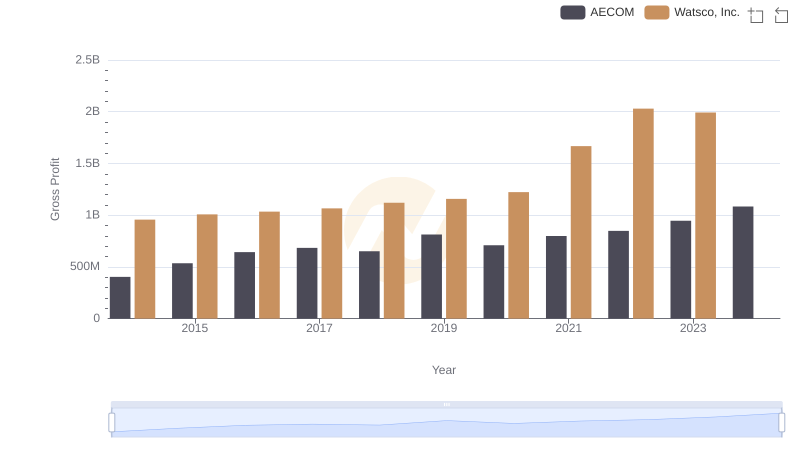
Who Generates Higher Gross Profit? Watsco, Inc. or AECOM
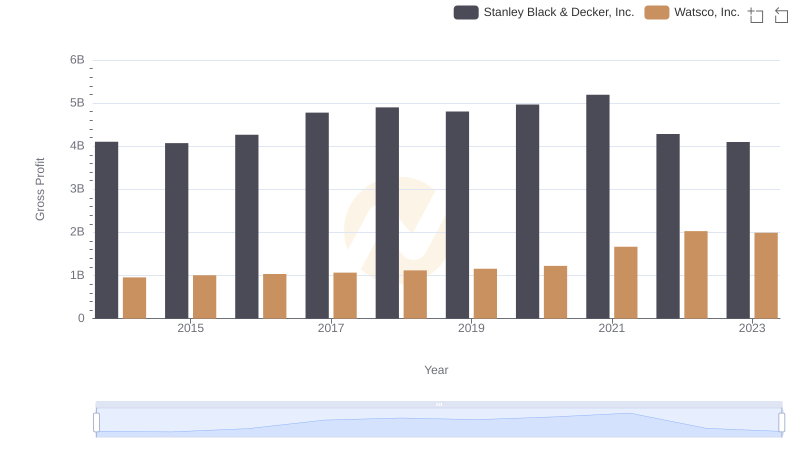
Gross Profit Trends Compared: Watsco, Inc. vs Stanley Black & Decker, Inc.
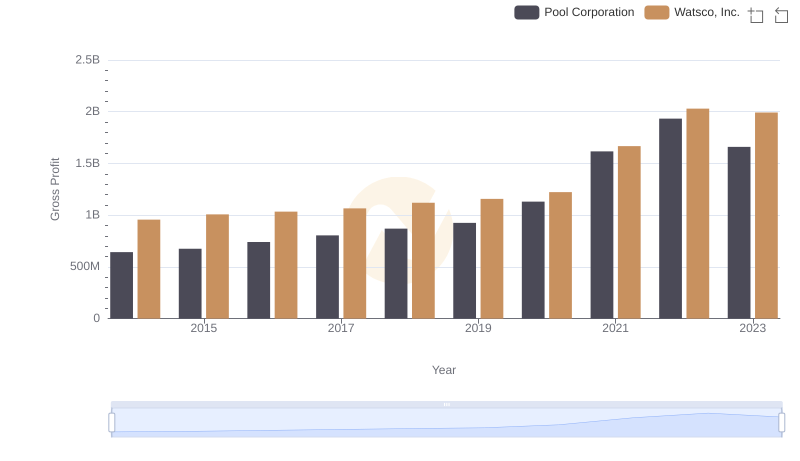
Watsco, Inc. and Pool Corporation: A Detailed Gross Profit Analysis

Professional EBITDA Benchmarking: Watsco, Inc. vs CNH Industrial N.V.