| __timestamp | Textron Inc. | Watsco, Inc. |
|---|---|---|
| Wednesday, January 1, 2014 | 13878000000 | 3944540000 |
| Thursday, January 1, 2015 | 13423000000 | 4113239000 |
| Friday, January 1, 2016 | 13788000000 | 4220702000 |
| Sunday, January 1, 2017 | 14198000000 | 4341955000 |
| Monday, January 1, 2018 | 13972000000 | 4546653000 |
| Tuesday, January 1, 2019 | 13630000000 | 4770362000 |
| Wednesday, January 1, 2020 | 11651000000 | 5054928000 |
| Friday, January 1, 2021 | 12382000000 | 6280192000 |
| Saturday, January 1, 2022 | 12869000000 | 7274344000 |
| Sunday, January 1, 2023 | 13683000000 | 7283767000 |
| Monday, January 1, 2024 | 13702000000 | 7618317000 |
Data in motion
In the ever-evolving landscape of the industrial sector, understanding revenue trends is crucial for investors and stakeholders. This analysis delves into the annual revenue performance of two industry giants: Watsco, Inc. and Textron Inc., from 2014 to 2023.
Textron Inc., a leader in aerospace and defense, has shown a steady revenue trajectory, peaking in 2017 with a 6% increase from 2016. However, a dip in 2020 saw revenues fall by 15%, likely due to global disruptions. In contrast, Watsco, Inc., a major player in HVAC distribution, demonstrated a robust growth pattern, with revenues surging by 85% over the decade, reaching a high in 2023.
While Textron's revenue rebounded post-2020, Watsco's consistent upward trend underscores its resilience and market adaptability. Notably, data for 2024 is incomplete, highlighting the need for ongoing analysis.
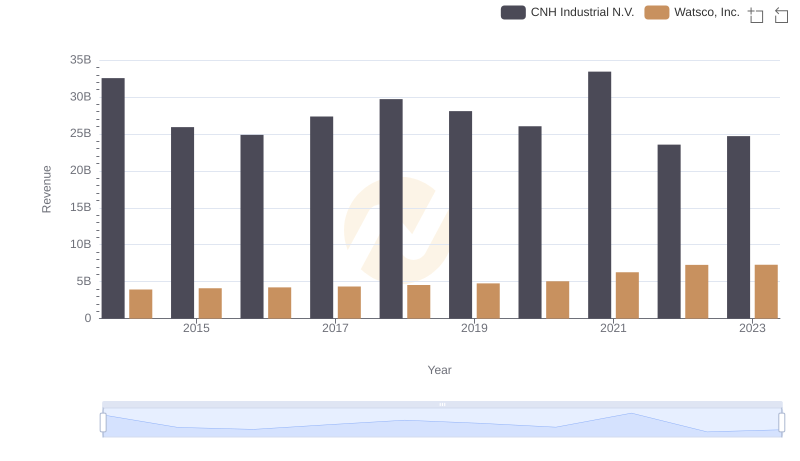
Comparing Revenue Performance: Watsco, Inc. or CNH Industrial N.V.?
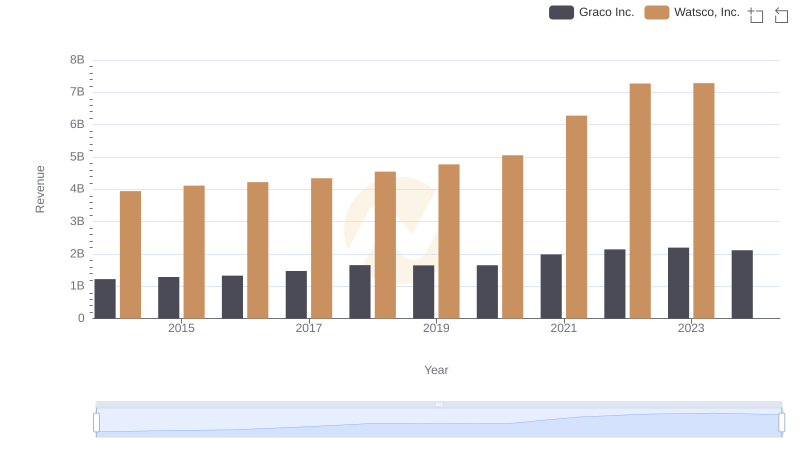
Watsco, Inc. or Graco Inc.: Who Leads in Yearly Revenue?
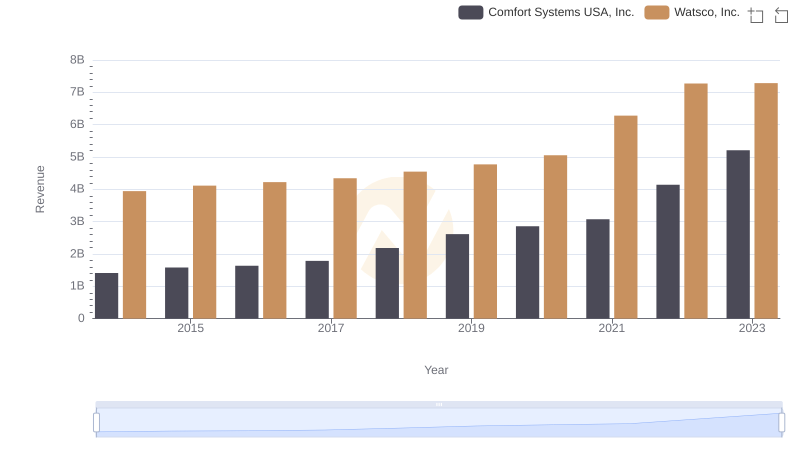
Watsco, Inc. or Comfort Systems USA, Inc.: Who Leads in Yearly Revenue?
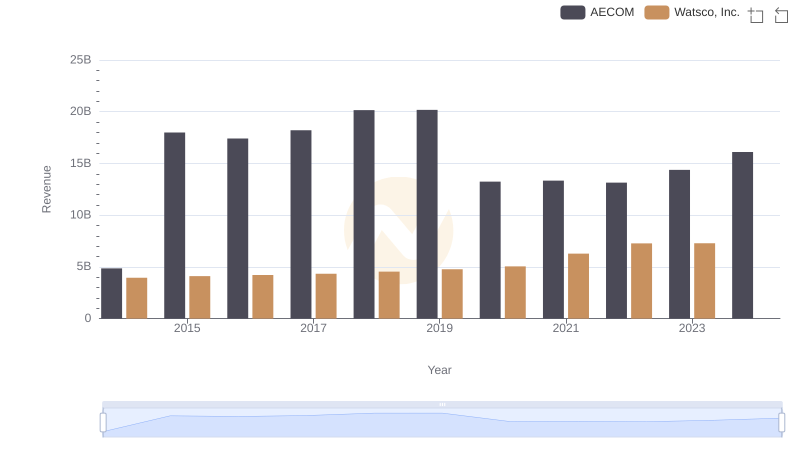
Watsco, Inc. vs AECOM: Annual Revenue Growth Compared
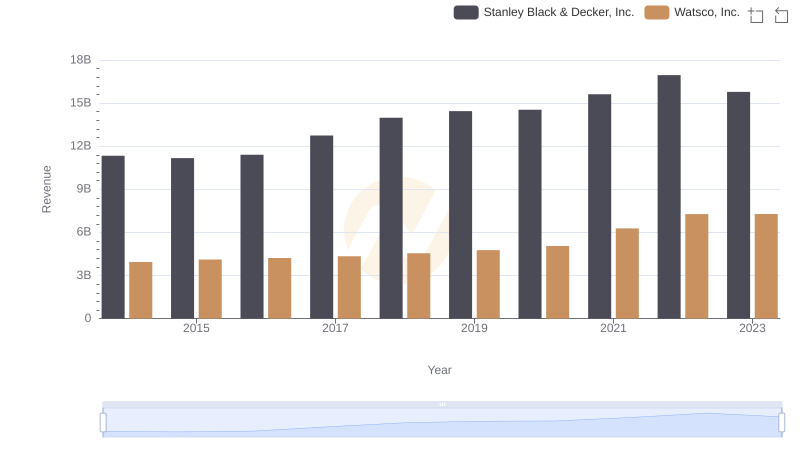
Who Generates More Revenue? Watsco, Inc. or Stanley Black & Decker, Inc.
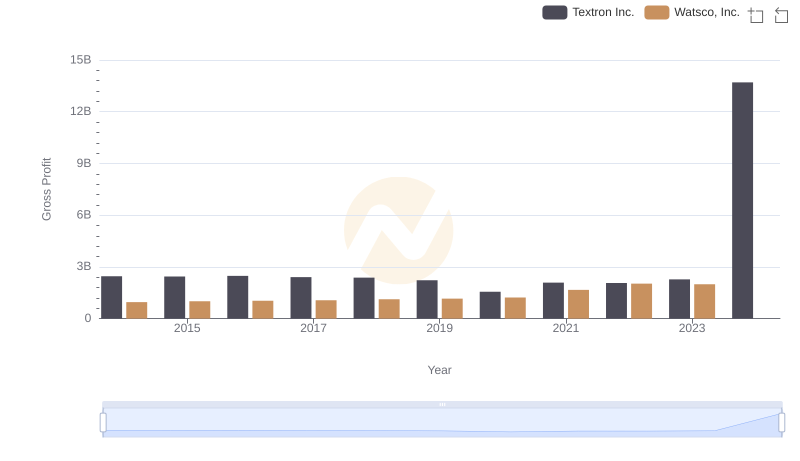
Watsco, Inc. vs Textron Inc.: A Gross Profit Performance Breakdown
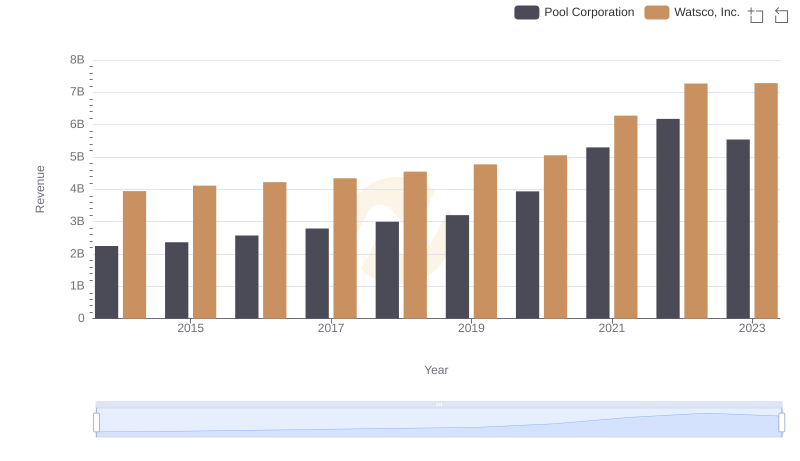
Watsco, Inc. vs Pool Corporation: Annual Revenue Growth Compared
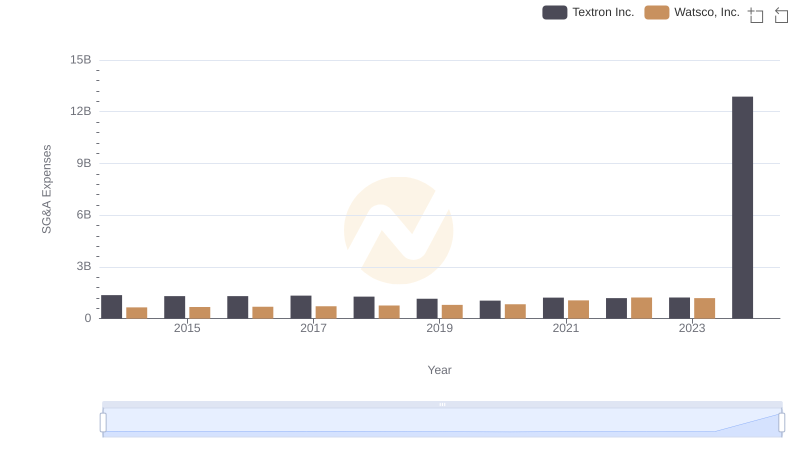
Operational Costs Compared: SG&A Analysis of Watsco, Inc. and Textron Inc.
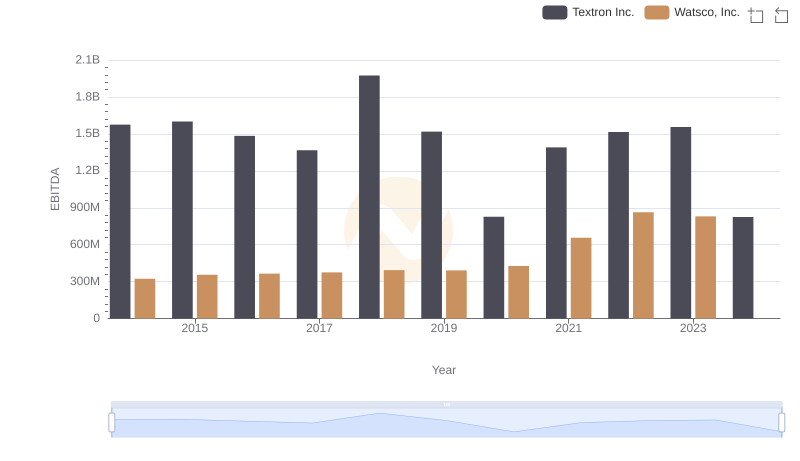
A Side-by-Side Analysis of EBITDA: Watsco, Inc. and Textron Inc.