| __timestamp | Watsco, Inc. | XPO Logistics, Inc. |
|---|---|---|
| Wednesday, January 1, 2014 | 956402000 | 381600000 |
| Thursday, January 1, 2015 | 1007357000 | 1084800000 |
| Friday, January 1, 2016 | 1034584000 | 2139300000 |
| Sunday, January 1, 2017 | 1065659000 | 2279700000 |
| Monday, January 1, 2018 | 1120252000 | 2541000000 |
| Tuesday, January 1, 2019 | 1156956000 | 2666000000 |
| Wednesday, January 1, 2020 | 1222821000 | 2563000000 |
| Friday, January 1, 2021 | 1667545000 | 1994000000 |
| Saturday, January 1, 2022 | 2030289000 | 1227000000 |
| Sunday, January 1, 2023 | 1992140000 | 770000000 |
| Monday, January 1, 2024 | 2044713000 | 915000000 |
Unveiling the hidden dimensions of data
In the competitive landscape of American business, Watsco, Inc. and XPO Logistics, Inc. have emerged as titans in their respective industries. Over the past decade, these companies have showcased remarkable growth in gross profit, reflecting their strategic prowess and market adaptability.
From 2014 to 2023, Watsco, Inc. demonstrated a steady upward trajectory, with gross profits peaking in 2022 at approximately 2 billion dollars, marking a 112% increase from 2014. Meanwhile, XPO Logistics, Inc. experienced a more volatile journey, with a significant surge in 2019, reaching its zenith at around 2.7 billion dollars, before a notable decline in subsequent years.
This performance breakdown not only highlights the resilience of Watsco, Inc. but also underscores the dynamic nature of XPO Logistics, Inc.'s business model. As we delve into these figures, it becomes evident that strategic decisions and market conditions have played pivotal roles in shaping their financial narratives.
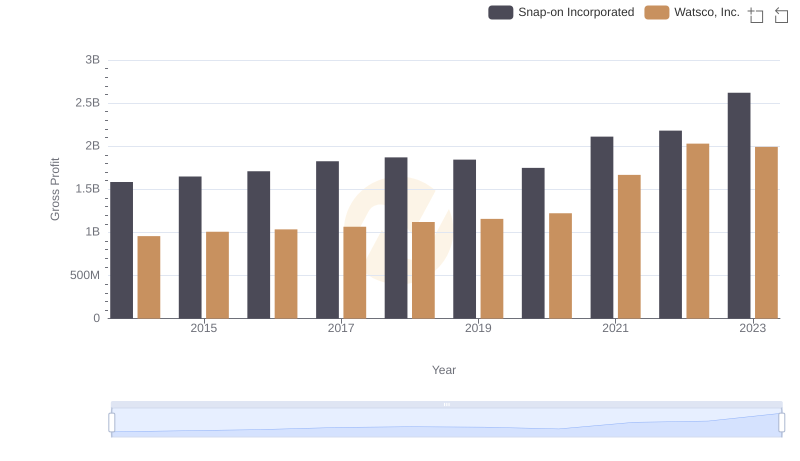
Gross Profit Comparison: Watsco, Inc. and Snap-on Incorporated Trends
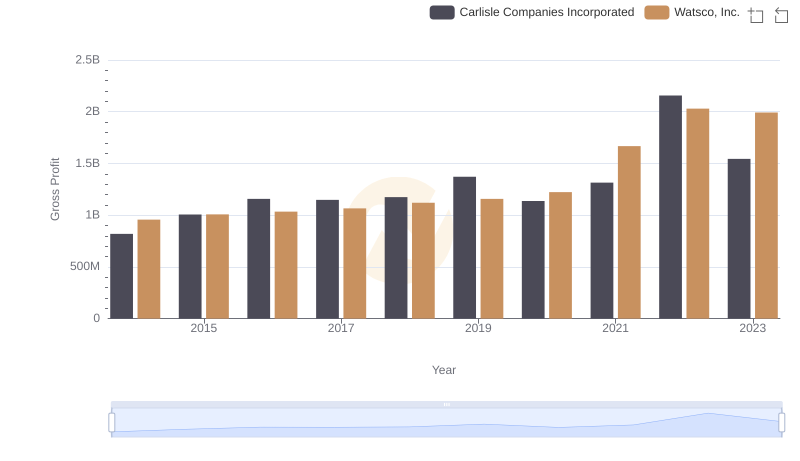
Key Insights on Gross Profit: Watsco, Inc. vs Carlisle Companies Incorporated
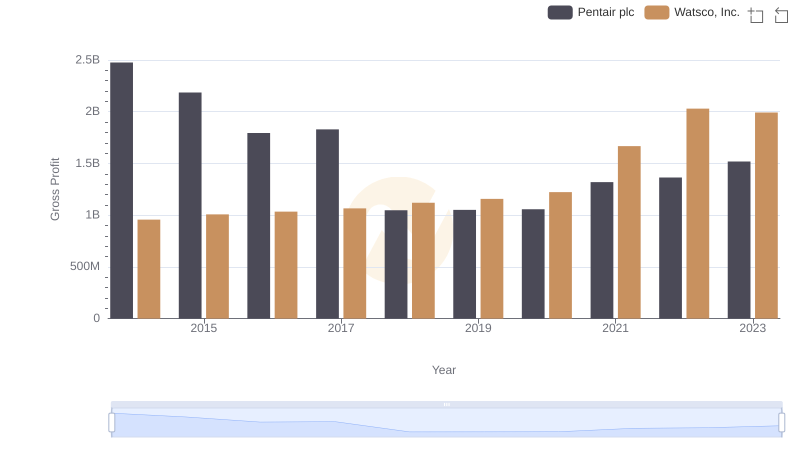
Gross Profit Comparison: Watsco, Inc. and Pentair plc Trends
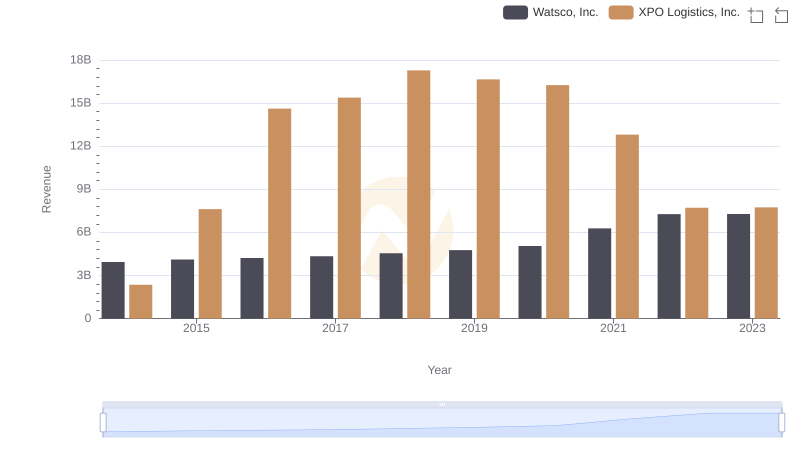
Annual Revenue Comparison: Watsco, Inc. vs XPO Logistics, Inc.
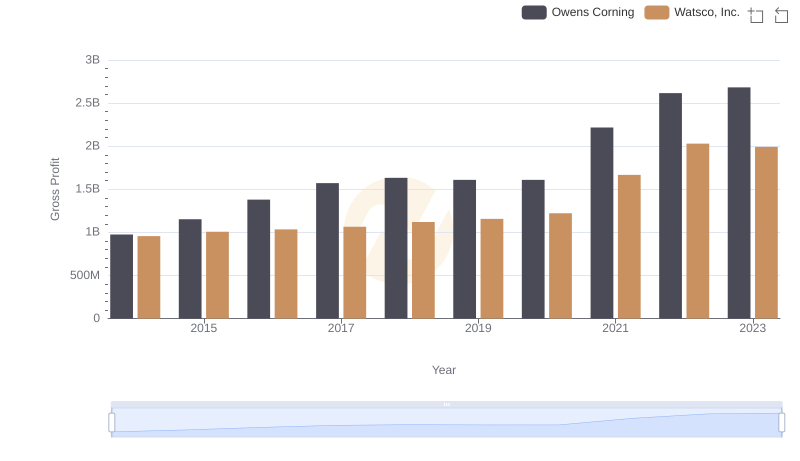
Gross Profit Trends Compared: Watsco, Inc. vs Owens Corning
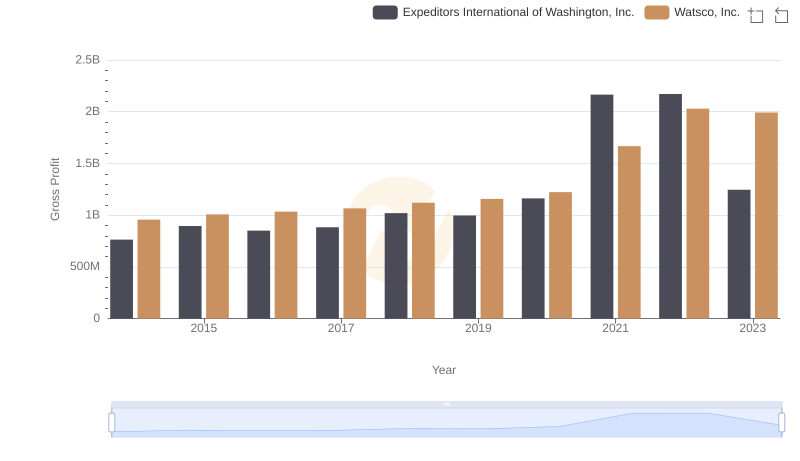
Gross Profit Trends Compared: Watsco, Inc. vs Expeditors International of Washington, Inc.
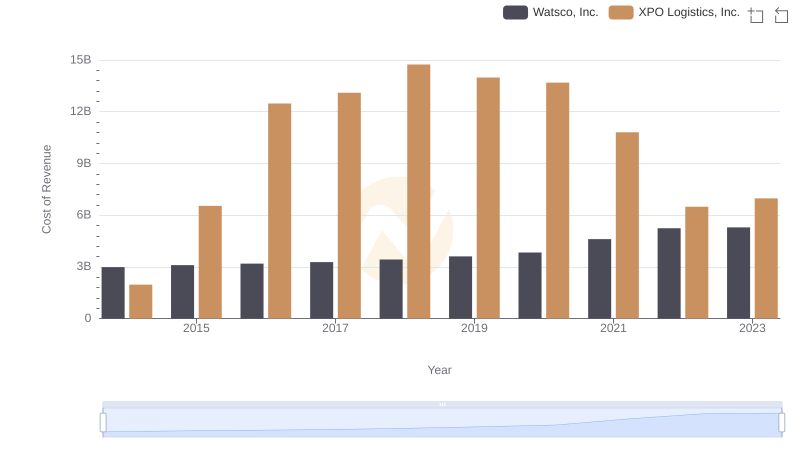
Comparing Cost of Revenue Efficiency: Watsco, Inc. vs XPO Logistics, Inc.
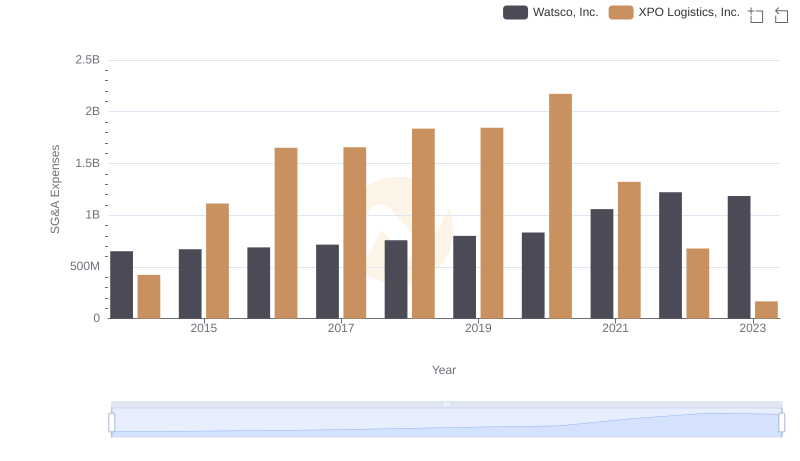
Breaking Down SG&A Expenses: Watsco, Inc. vs XPO Logistics, Inc.
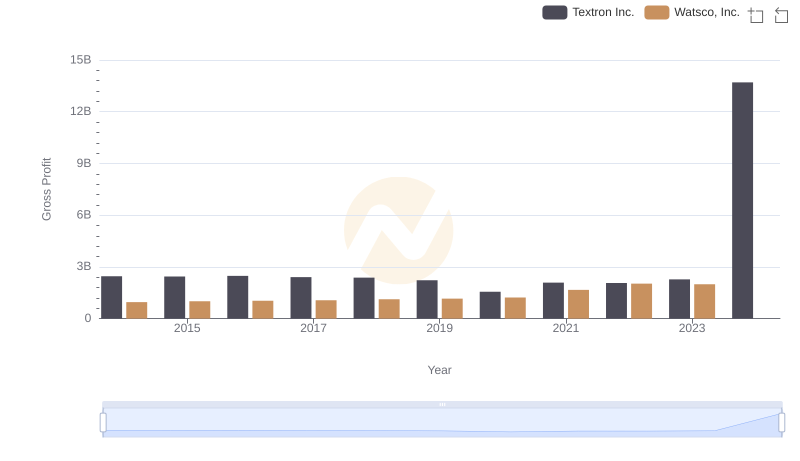
Watsco, Inc. vs Textron Inc.: A Gross Profit Performance Breakdown
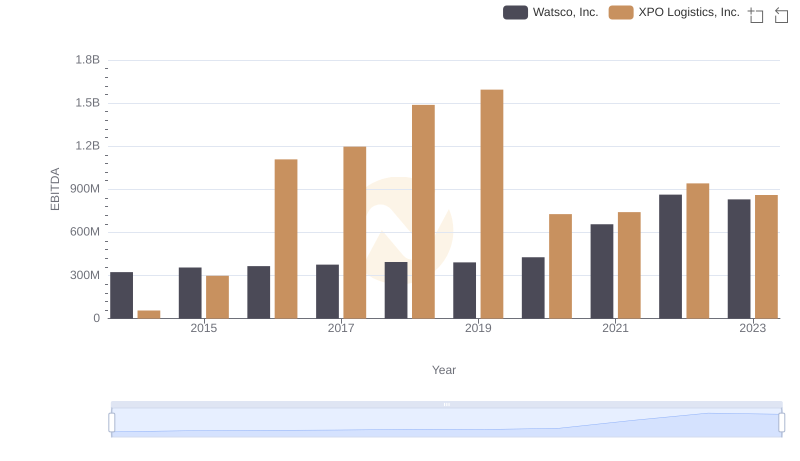
Comparative EBITDA Analysis: Watsco, Inc. vs XPO Logistics, Inc.