| __timestamp | Snap-on Incorporated | Watsco, Inc. |
|---|---|---|
| Wednesday, January 1, 2014 | 3277700000 | 3944540000 |
| Thursday, January 1, 2015 | 3352800000 | 4113239000 |
| Friday, January 1, 2016 | 3430400000 | 4220702000 |
| Sunday, January 1, 2017 | 3686900000 | 4341955000 |
| Monday, January 1, 2018 | 3740700000 | 4546653000 |
| Tuesday, January 1, 2019 | 3730000000 | 4770362000 |
| Wednesday, January 1, 2020 | 3592500000 | 5054928000 |
| Friday, January 1, 2021 | 4252000000 | 6280192000 |
| Saturday, January 1, 2022 | 4492800000 | 7274344000 |
| Sunday, January 1, 2023 | 5108300000 | 7283767000 |
| Monday, January 1, 2024 | 4707400000 | 7618317000 |
Unlocking the unknown
In the ever-evolving landscape of industrial and consumer goods, Watsco, Inc. and Snap-on Incorporated have emerged as formidable players. Over the past decade, from 2014 to 2023, these companies have demonstrated remarkable revenue growth. Watsco, Inc. has seen its revenue soar by approximately 85%, reaching a peak in 2023. Meanwhile, Snap-on Incorporated has experienced a steady increase of around 56% during the same period.
Watsco's revenue growth is particularly impressive, with a significant surge in 2021, marking a 24% increase from the previous year. This growth trajectory highlights the company's strategic positioning in the HVAC distribution market. On the other hand, Snap-on's consistent growth underscores its resilience and adaptability in the tools and equipment sector.
This analysis provides a compelling snapshot of how these industry giants have navigated economic challenges and capitalized on market opportunities.
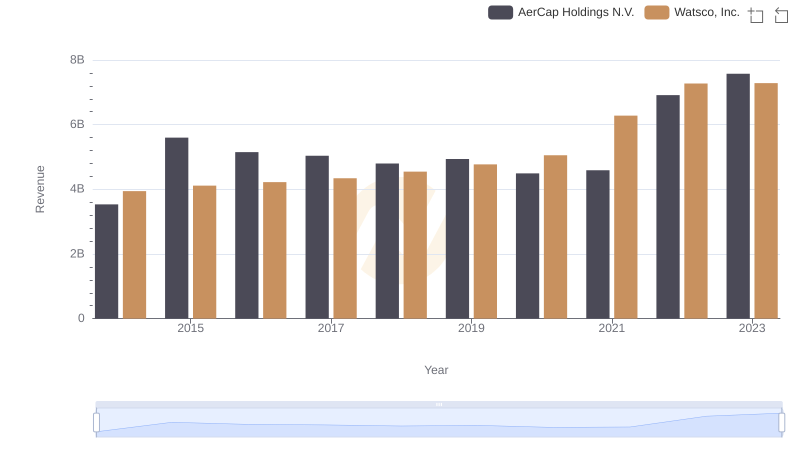
Watsco, Inc. vs AerCap Holdings N.V.: Examining Key Revenue Metrics
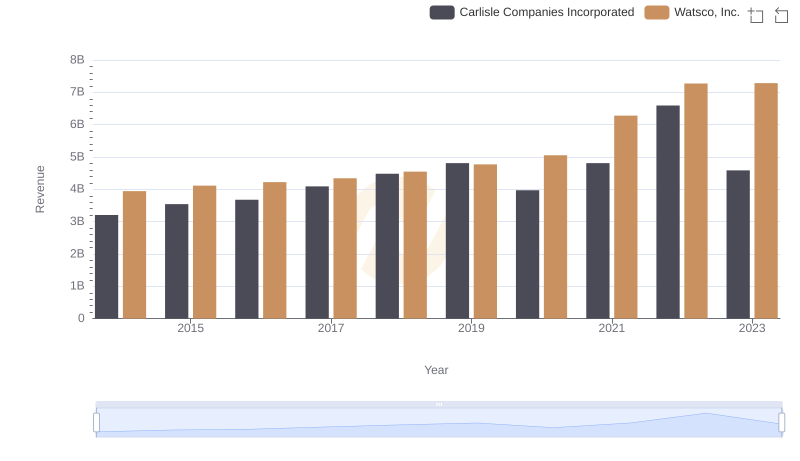
Annual Revenue Comparison: Watsco, Inc. vs Carlisle Companies Incorporated
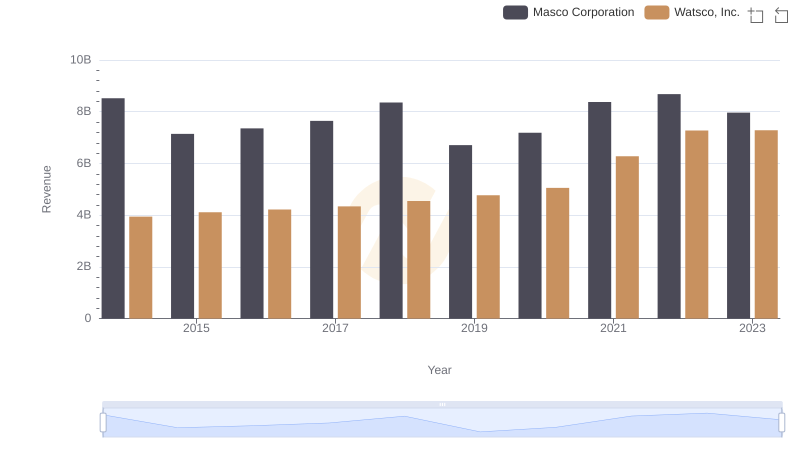
Revenue Insights: Watsco, Inc. and Masco Corporation Performance Compared
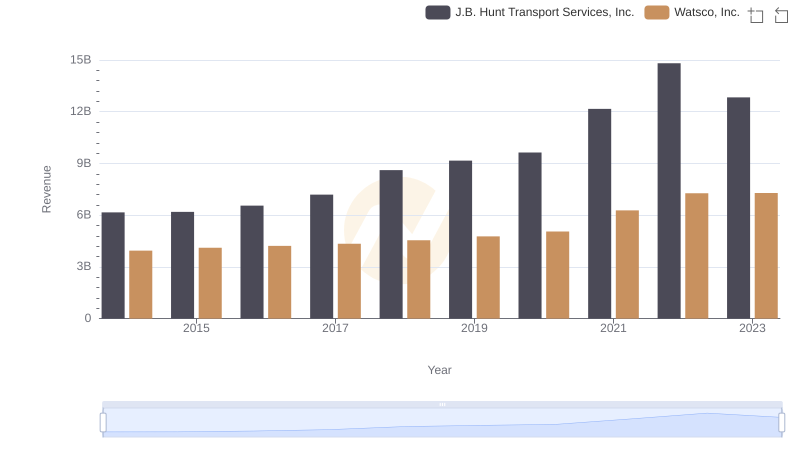
Watsco, Inc. vs J.B. Hunt Transport Services, Inc.: Annual Revenue Growth Compared
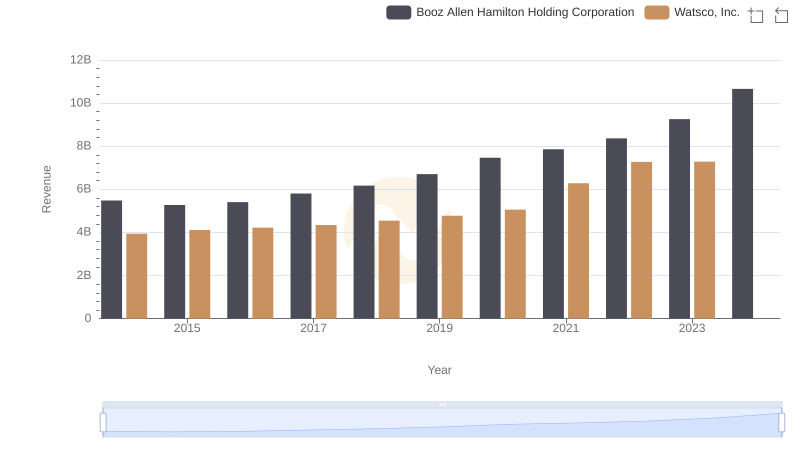
Watsco, Inc. vs Booz Allen Hamilton Holding Corporation: Annual Revenue Growth Compared
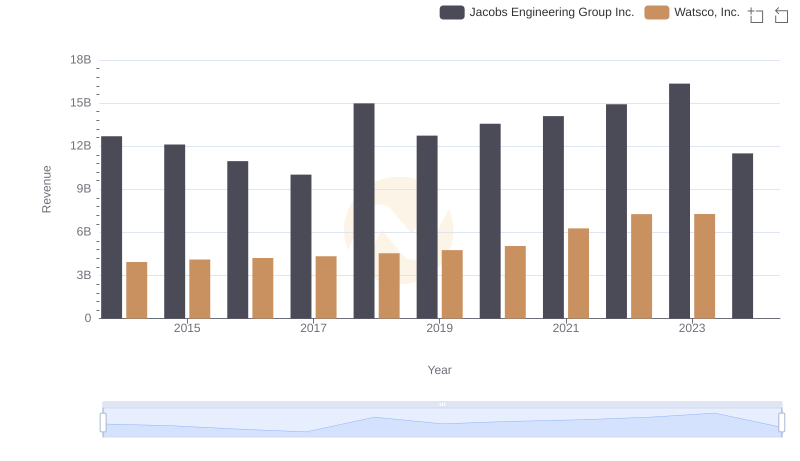
Breaking Down Revenue Trends: Watsco, Inc. vs Jacobs Engineering Group Inc.
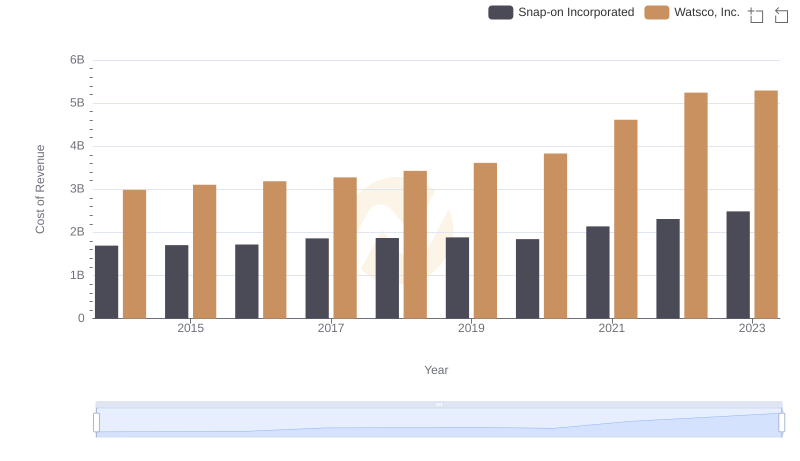
Cost Insights: Breaking Down Watsco, Inc. and Snap-on Incorporated's Expenses
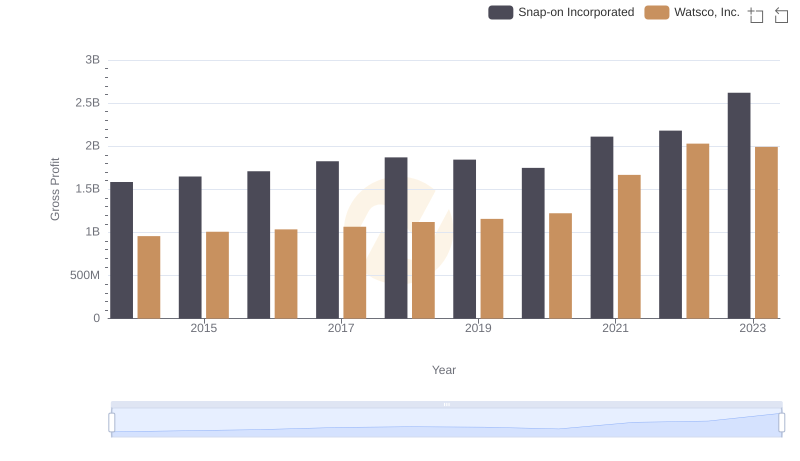
Gross Profit Comparison: Watsco, Inc. and Snap-on Incorporated Trends
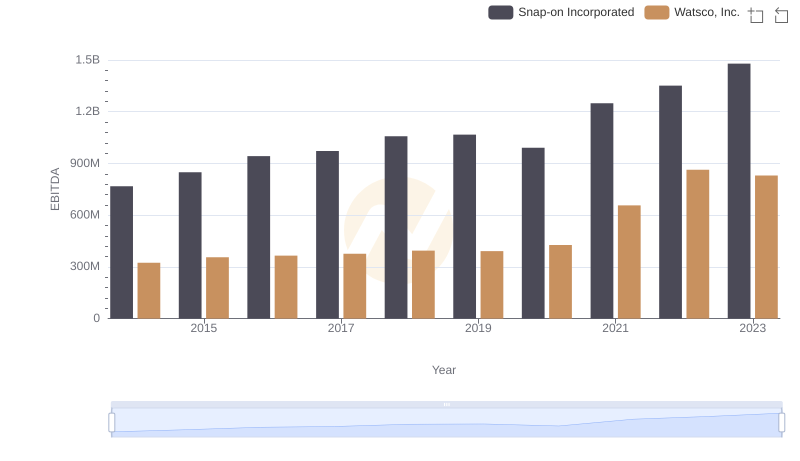
Comparative EBITDA Analysis: Watsco, Inc. vs Snap-on Incorporated