| __timestamp | Jacobs Engineering Group Inc. | Watsco, Inc. |
|---|---|---|
| Wednesday, January 1, 2014 | 699015000 | 323674000 |
| Thursday, January 1, 2015 | 598932000 | 355865000 |
| Friday, January 1, 2016 | 431954000 | 365698000 |
| Sunday, January 1, 2017 | 527765000 | 375907000 |
| Monday, January 1, 2018 | 606328000 | 394177000 |
| Tuesday, January 1, 2019 | 604075000 | 391396000 |
| Wednesday, January 1, 2020 | 685042000 | 426942000 |
| Friday, January 1, 2021 | 1019116000 | 656655000 |
| Saturday, January 1, 2022 | 1277649000 | 863261000 |
| Sunday, January 1, 2023 | 1392039000 | 829900000 |
| Monday, January 1, 2024 | 1255083000 | 781775000 |
Igniting the spark of knowledge
In the competitive landscape of engineering and HVAC distribution, Jacobs Engineering Group Inc. and Watsco, Inc. have showcased distinct trajectories in their EBITDA performance over the past decade. From 2014 to 2023, Jacobs Engineering has seen a remarkable growth of approximately 99%, peaking in 2023 with an EBITDA of 1.39 billion. This growth underscores their strategic expansions and operational efficiencies. Meanwhile, Watsco, Inc. has demonstrated a steady climb, with a notable 166% increase from 2014 to 2022, reaching its zenith in 2022. However, 2023 data for Watsco remains elusive, leaving analysts eager for updates. This comparison not only highlights the resilience and adaptability of these industry leaders but also offers a glimpse into the evolving dynamics of their respective sectors.
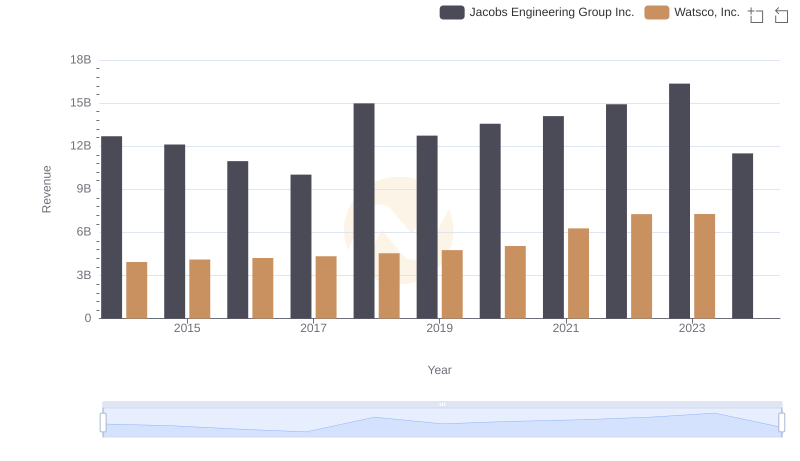
Breaking Down Revenue Trends: Watsco, Inc. vs Jacobs Engineering Group Inc.
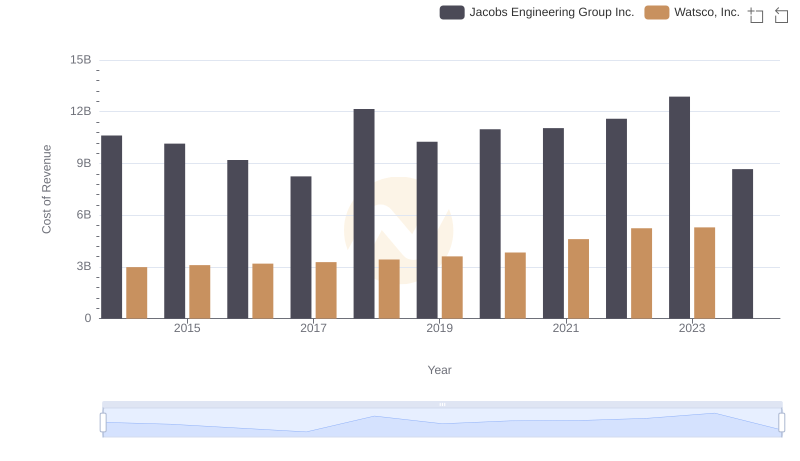
Cost of Revenue: Key Insights for Watsco, Inc. and Jacobs Engineering Group Inc.
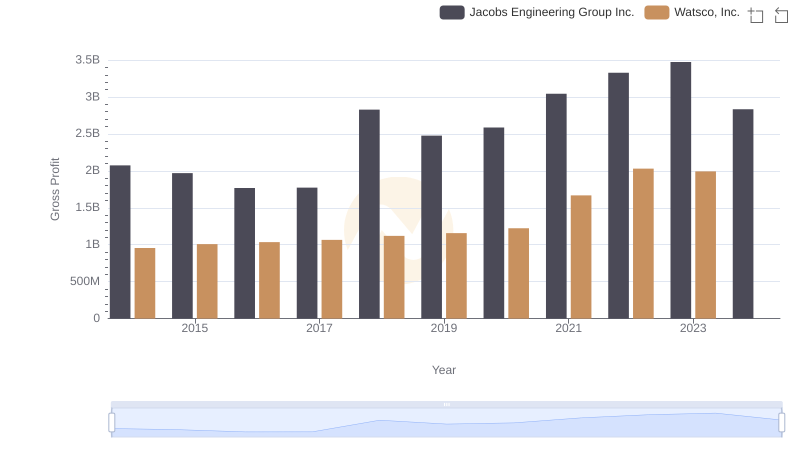
Key Insights on Gross Profit: Watsco, Inc. vs Jacobs Engineering Group Inc.
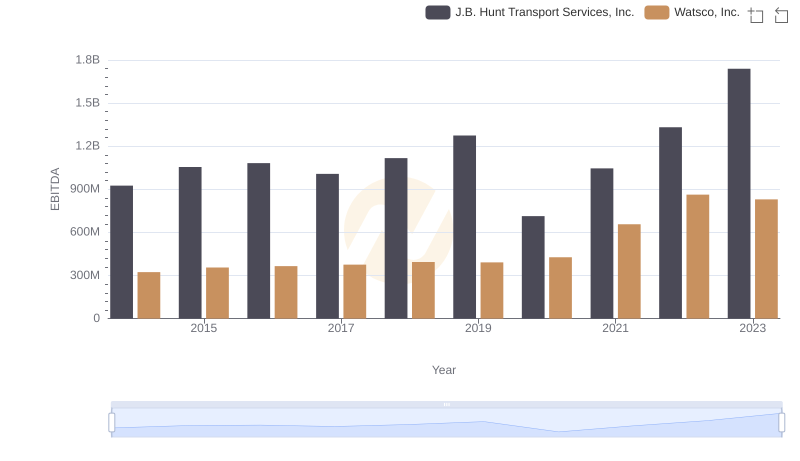
A Professional Review of EBITDA: Watsco, Inc. Compared to J.B. Hunt Transport Services, Inc.
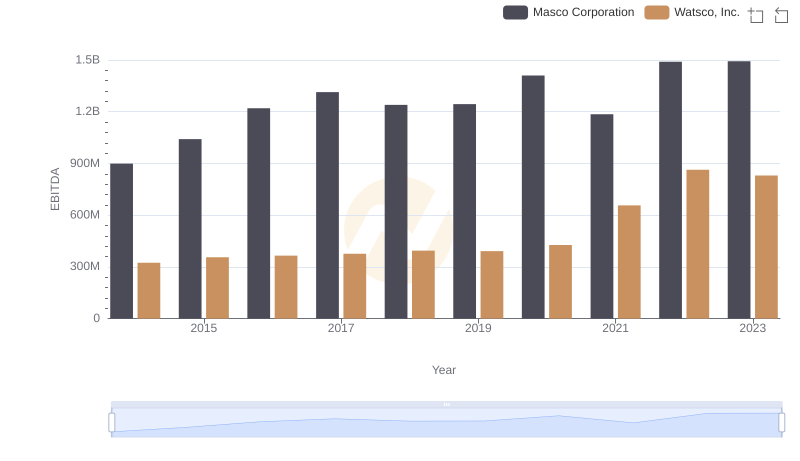
Comparative EBITDA Analysis: Watsco, Inc. vs Masco Corporation
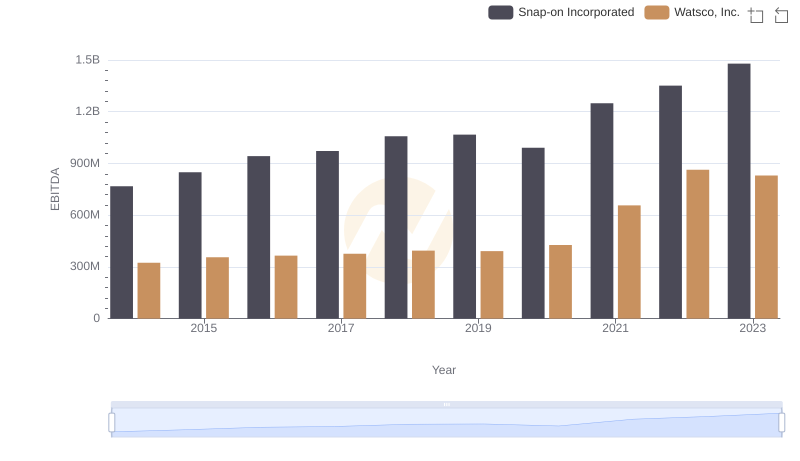
Comparative EBITDA Analysis: Watsco, Inc. vs Snap-on Incorporated
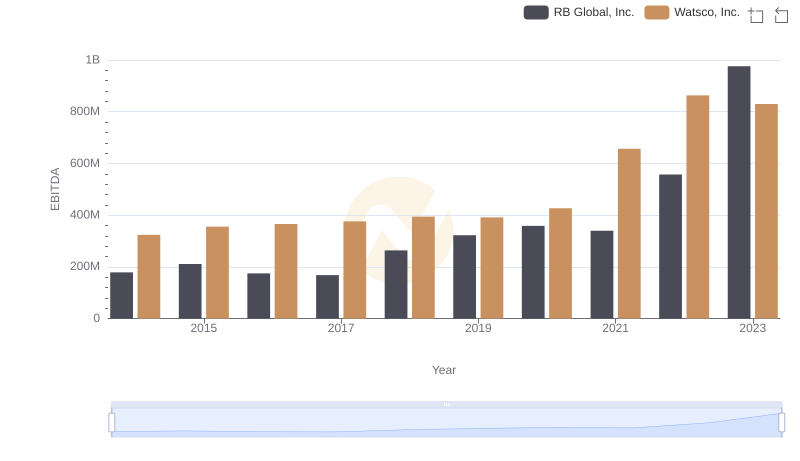
Comprehensive EBITDA Comparison: Watsco, Inc. vs RB Global, Inc.