| __timestamp | IDEX Corporation | Watsco, Inc. |
|---|---|---|
| Wednesday, January 1, 2014 | 504419000 | 650655000 |
| Thursday, January 1, 2015 | 479408000 | 670609000 |
| Friday, January 1, 2016 | 498994000 | 688952000 |
| Sunday, January 1, 2017 | 524940000 | 715671000 |
| Monday, January 1, 2018 | 536724000 | 757452000 |
| Tuesday, January 1, 2019 | 524987000 | 800328000 |
| Wednesday, January 1, 2020 | 494935000 | 833051000 |
| Friday, January 1, 2021 | 578200000 | 1058316000 |
| Saturday, January 1, 2022 | 652700000 | 1221382000 |
| Sunday, January 1, 2023 | 703500000 | 1185626000 |
| Monday, January 1, 2024 | 758700000 | 1262938000 |
Unlocking the unknown
In the ever-evolving landscape of corporate finance, understanding the trends in Selling, General, and Administrative (SG&A) expenses is crucial for investors and analysts alike. Over the past decade, from 2014 to 2023, Watsco, Inc. and IDEX Corporation have showcased distinct trajectories in their SG&A expenditures.
Watsco, Inc. has consistently outpaced IDEX Corporation, with its SG&A expenses growing by approximately 82% over this period. Notably, in 2021, Watsco's expenses surged past the billion-dollar mark, reflecting a robust expansion strategy. In contrast, IDEX Corporation's SG&A expenses increased by about 40%, indicating a more conservative growth approach.
The year 2023 marked a pivotal point, with IDEX Corporation reaching its highest SG&A expenses, suggesting a potential shift in strategy. These insights provide a window into the operational priorities and strategic directions of these industry giants.
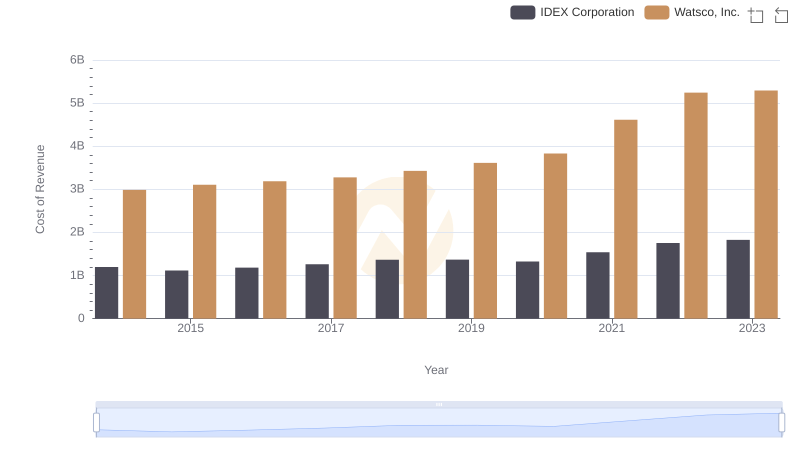
Cost Insights: Breaking Down Watsco, Inc. and IDEX Corporation's Expenses
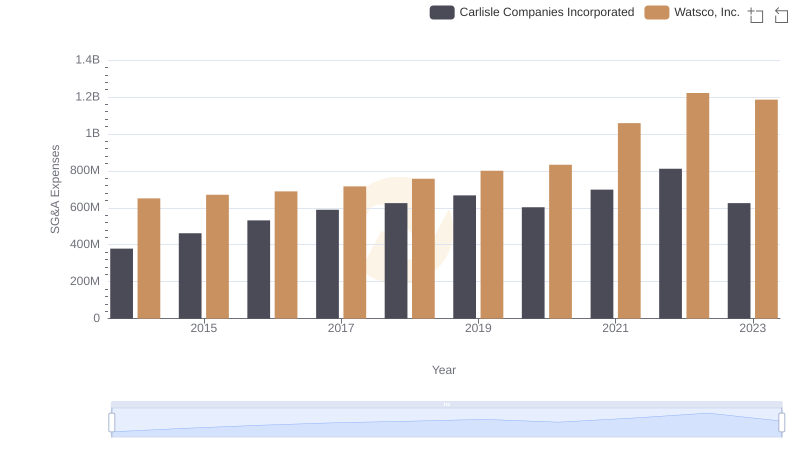
Watsco, Inc. and Carlisle Companies Incorporated: SG&A Spending Patterns Compared
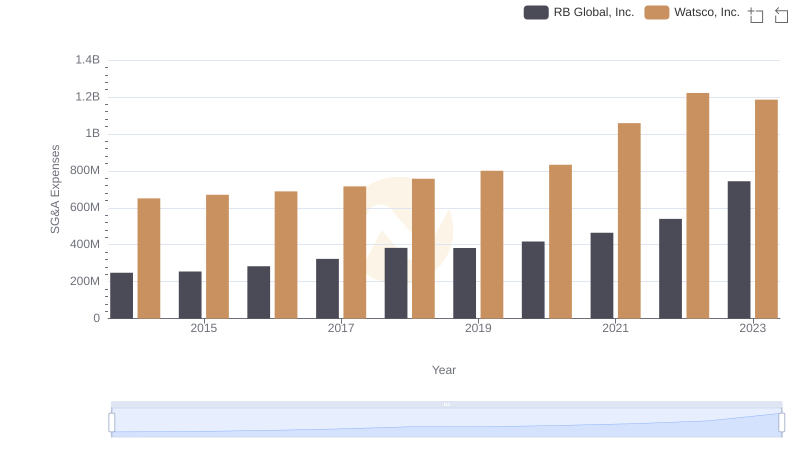
Selling, General, and Administrative Costs: Watsco, Inc. vs RB Global, Inc.
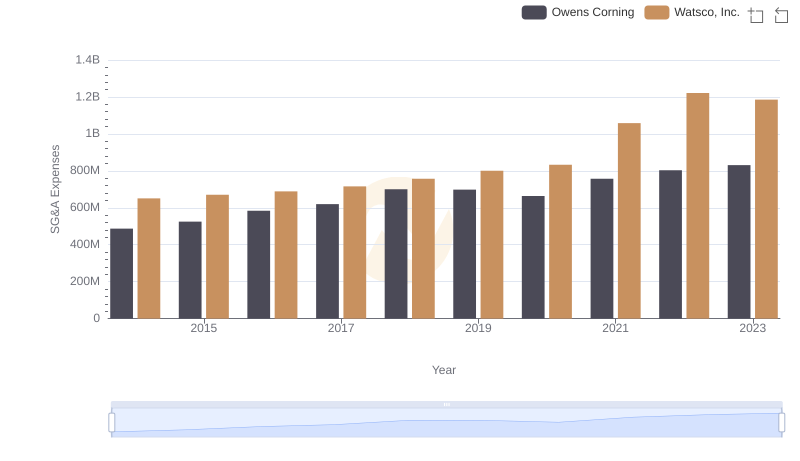
Selling, General, and Administrative Costs: Watsco, Inc. vs Owens Corning
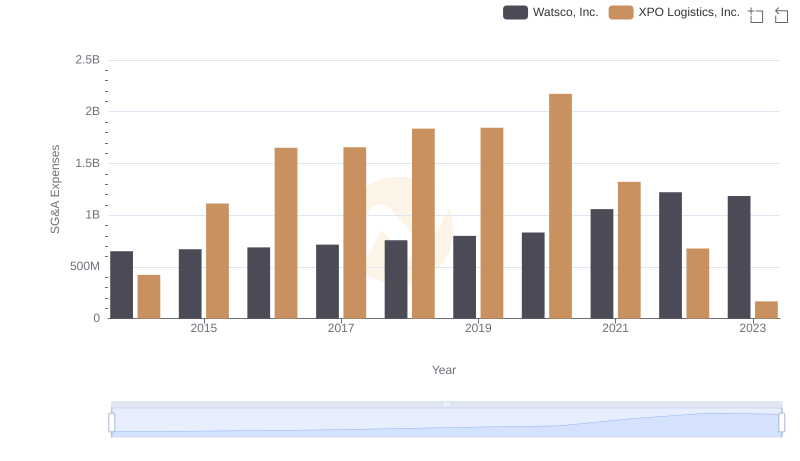
Breaking Down SG&A Expenses: Watsco, Inc. vs XPO Logistics, Inc.
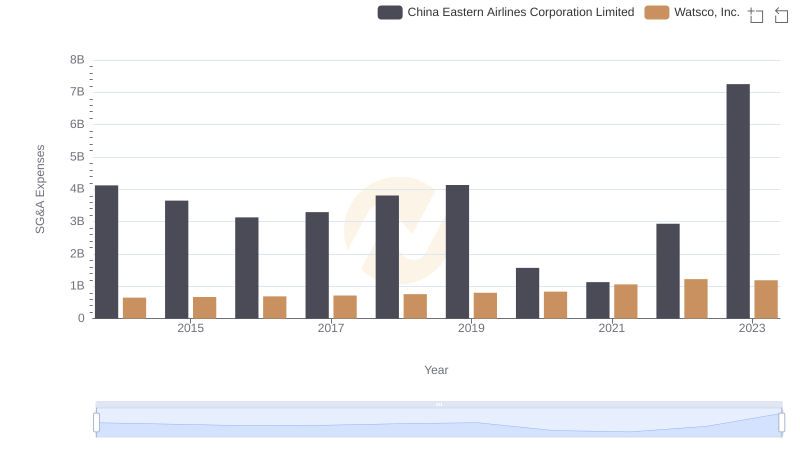
Cost Management Insights: SG&A Expenses for Watsco, Inc. and China Eastern Airlines Corporation Limited

Watsco, Inc. vs IDEX Corporation: In-Depth EBITDA Performance Comparison
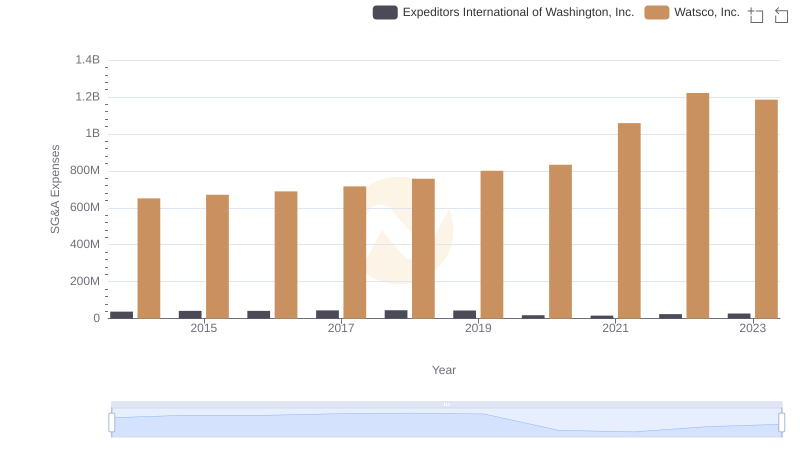
SG&A Efficiency Analysis: Comparing Watsco, Inc. and Expeditors International of Washington, Inc.