| __timestamp | Johnson Controls International plc | Waste Management, Inc. |
|---|---|---|
| Wednesday, January 1, 2014 | 36201000000 | 9002000000 |
| Thursday, January 1, 2015 | 30732000000 | 8231000000 |
| Friday, January 1, 2016 | 15183000000 | 8486000000 |
| Sunday, January 1, 2017 | 20833000000 | 9021000000 |
| Monday, January 1, 2018 | 22020000000 | 9249000000 |
| Tuesday, January 1, 2019 | 16275000000 | 9496000000 |
| Wednesday, January 1, 2020 | 14906000000 | 9341000000 |
| Friday, January 1, 2021 | 15609000000 | 11111000000 |
| Saturday, January 1, 2022 | 16956000000 | 12294000000 |
| Sunday, January 1, 2023 | 17822000000 | 12606000000 |
| Monday, January 1, 2024 | 14875000000 | 13383000000 |
In pursuit of knowledge
In the ever-evolving landscape of corporate expenses, understanding cost structures is crucial. Waste Management, Inc. and Johnson Controls International plc, two giants in their respective fields, offer intriguing insights into cost management over the past decade. From 2014 to 2023, Johnson Controls experienced a significant fluctuation in its cost of revenue, peaking in 2014 and then declining by nearly 60% by 2024. In contrast, Waste Management's costs remained relatively stable, with a modest increase of about 40% over the same period.
This data highlights the dynamic nature of cost management strategies. While Johnson Controls faced volatility, Waste Management's steady approach underscores its resilience. Notably, the absence of 2024 data for Waste Management suggests a potential shift or anomaly worth exploring. As businesses navigate financial complexities, these insights provide a valuable lens into strategic cost management.
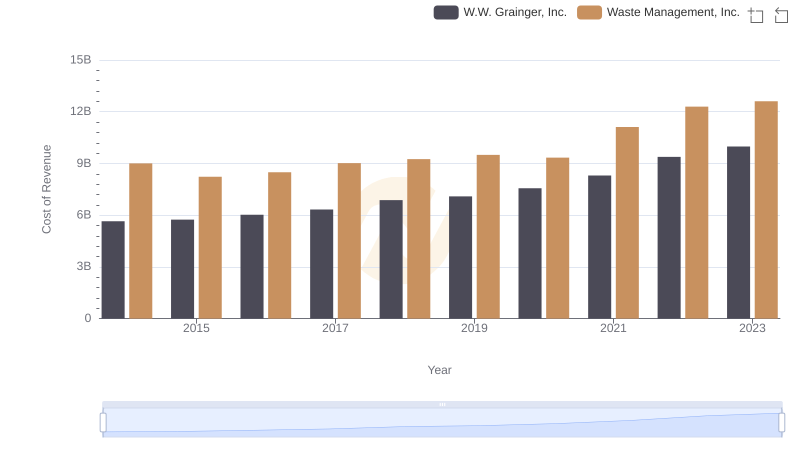
Waste Management, Inc. vs W.W. Grainger, Inc.: Efficiency in Cost of Revenue Explored

Comparing Revenue Performance: Waste Management, Inc. or Johnson Controls International plc?
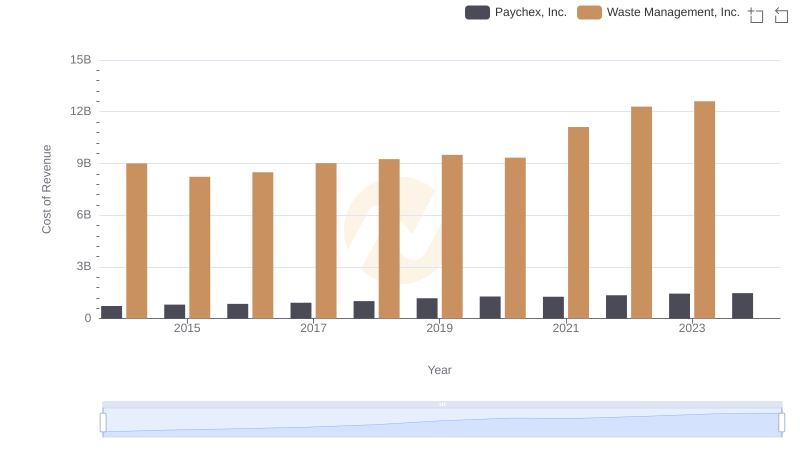
Cost of Revenue Comparison: Waste Management, Inc. vs Paychex, Inc.
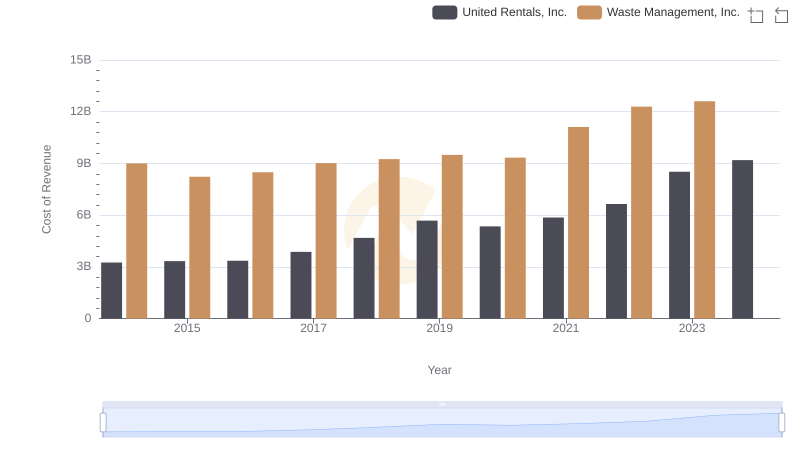
Analyzing Cost of Revenue: Waste Management, Inc. and United Rentals, Inc.
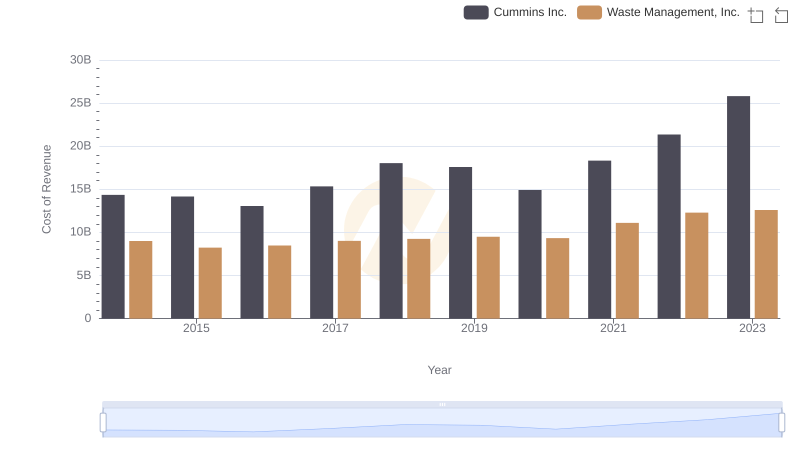
Waste Management, Inc. vs Cummins Inc.: Efficiency in Cost of Revenue Explored

Analyzing Cost of Revenue: Waste Management, Inc. and Axon Enterprise, Inc.
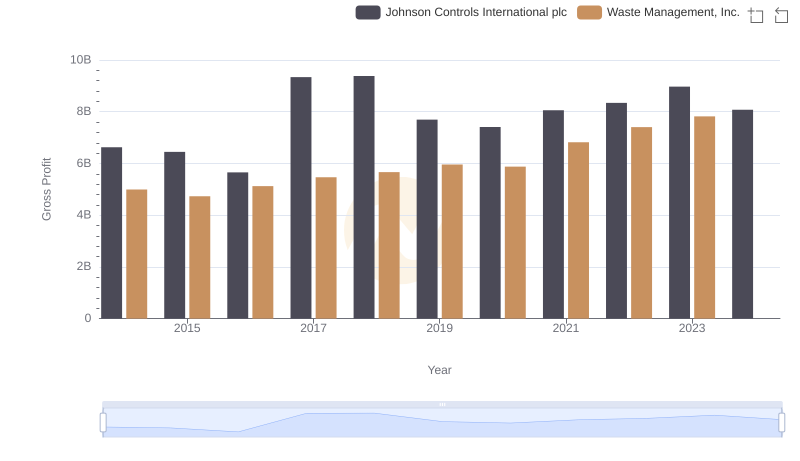
Waste Management, Inc. and Johnson Controls International plc: A Detailed Gross Profit Analysis
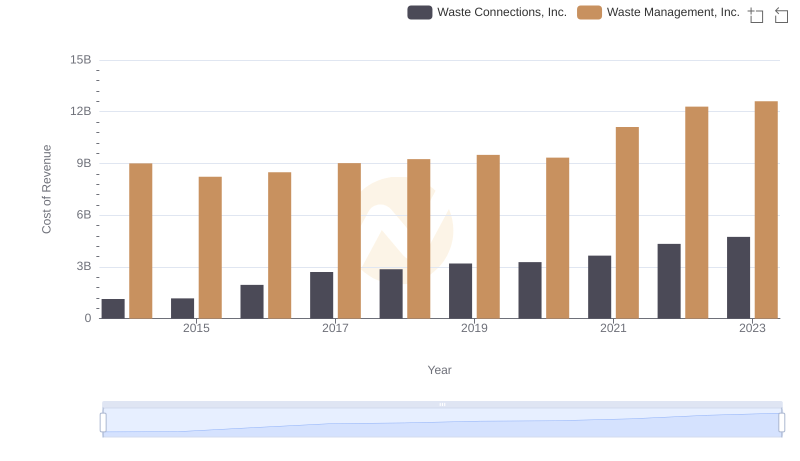
Waste Management, Inc. vs Waste Connections, Inc.: Efficiency in Cost of Revenue Explored
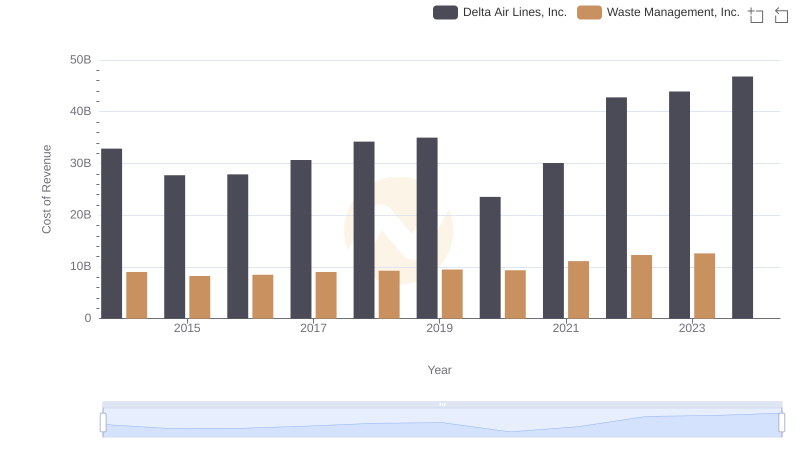
Cost of Revenue: Key Insights for Waste Management, Inc. and Delta Air Lines, Inc.
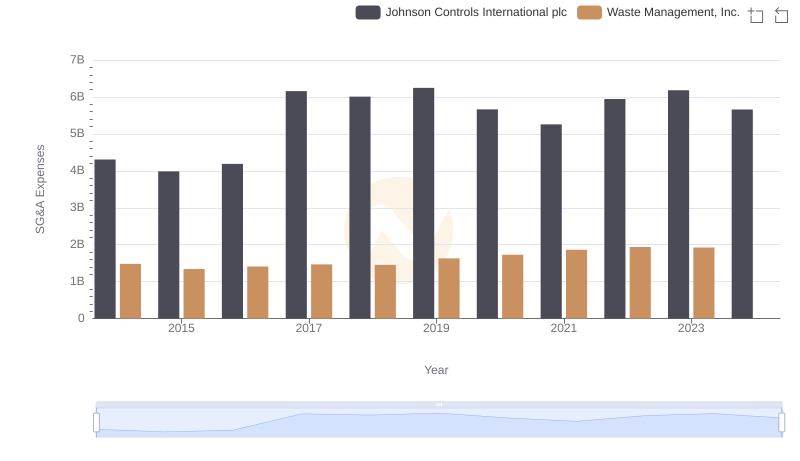
Waste Management, Inc. and Johnson Controls International plc: SG&A Spending Patterns Compared
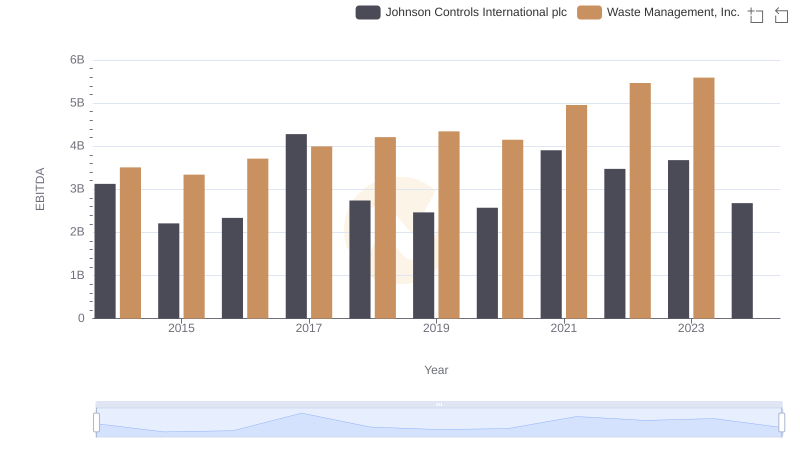
EBITDA Metrics Evaluated: Waste Management, Inc. vs Johnson Controls International plc