| __timestamp | United Rentals, Inc. | Waste Management, Inc. |
|---|---|---|
| Wednesday, January 1, 2014 | 3253000000 | 9002000000 |
| Thursday, January 1, 2015 | 3337000000 | 8231000000 |
| Friday, January 1, 2016 | 3359000000 | 8486000000 |
| Sunday, January 1, 2017 | 3872000000 | 9021000000 |
| Monday, January 1, 2018 | 4683000000 | 9249000000 |
| Tuesday, January 1, 2019 | 5681000000 | 9496000000 |
| Wednesday, January 1, 2020 | 5347000000 | 9341000000 |
| Friday, January 1, 2021 | 5863000000 | 11111000000 |
| Saturday, January 1, 2022 | 6646000000 | 12294000000 |
| Sunday, January 1, 2023 | 8519000000 | 12606000000 |
| Monday, January 1, 2024 | 9195000000 | 13383000000 |
Unleashing the power of data
In the ever-evolving landscape of industrial services, Waste Management, Inc. and United Rentals, Inc. stand as titans. Over the past decade, these companies have showcased distinct trajectories in their cost of revenue. From 2014 to 2023, Waste Management's cost of revenue surged by approximately 40%, peaking at over $12.6 billion in 2023. Meanwhile, United Rentals experienced a staggering 180% increase, reaching nearly $9.2 billion in the same year. This growth reflects their strategic expansions and market adaptations. Notably, 2024 data for Waste Management remains elusive, hinting at potential shifts or reporting delays. As these industry leaders continue to navigate economic challenges and opportunities, their financial strategies offer valuable insights into the broader market dynamics. Stay tuned as we delve deeper into the factors driving these trends and what they mean for the future of industrial services.
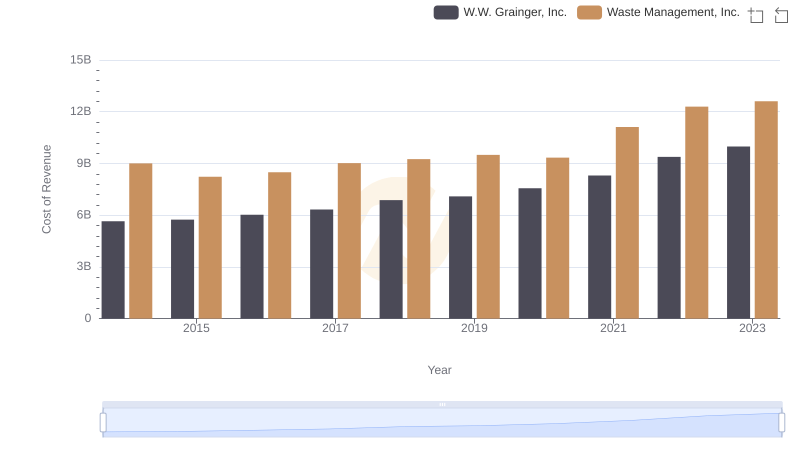
Waste Management, Inc. vs W.W. Grainger, Inc.: Efficiency in Cost of Revenue Explored
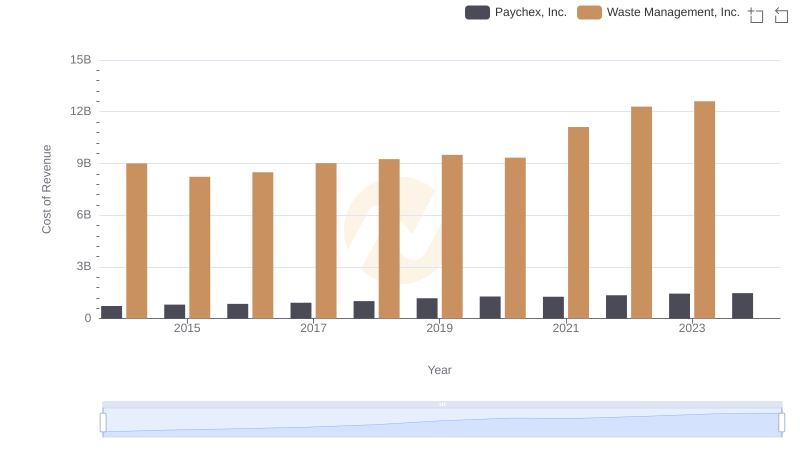
Cost of Revenue Comparison: Waste Management, Inc. vs Paychex, Inc.
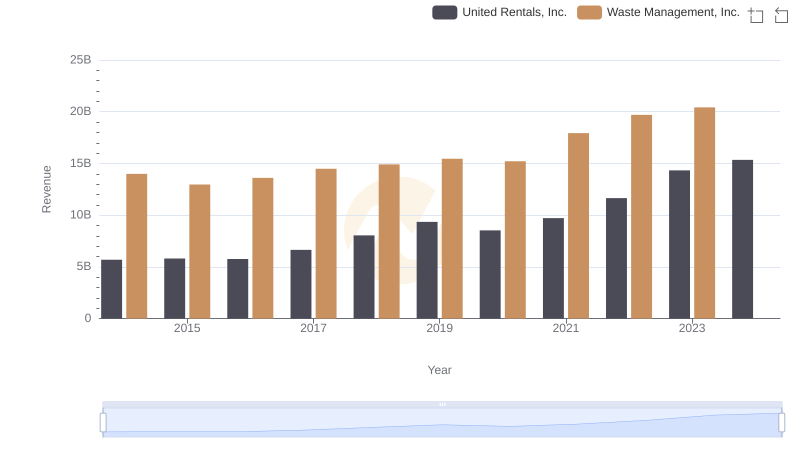
Annual Revenue Comparison: Waste Management, Inc. vs United Rentals, Inc.
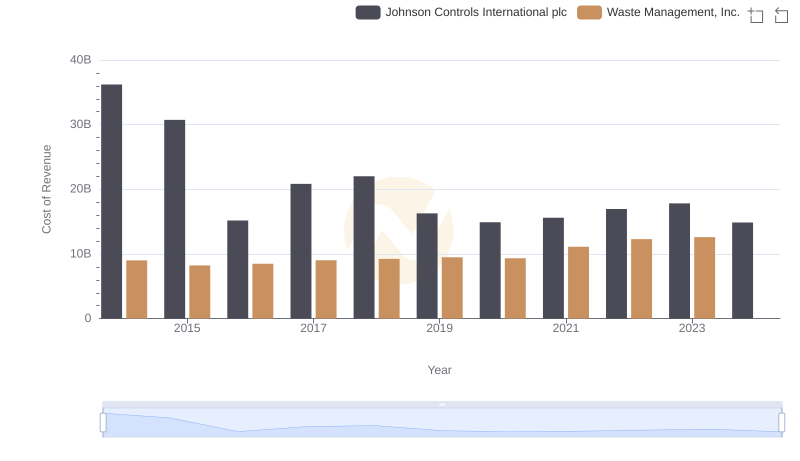
Cost Insights: Breaking Down Waste Management, Inc. and Johnson Controls International plc's Expenses
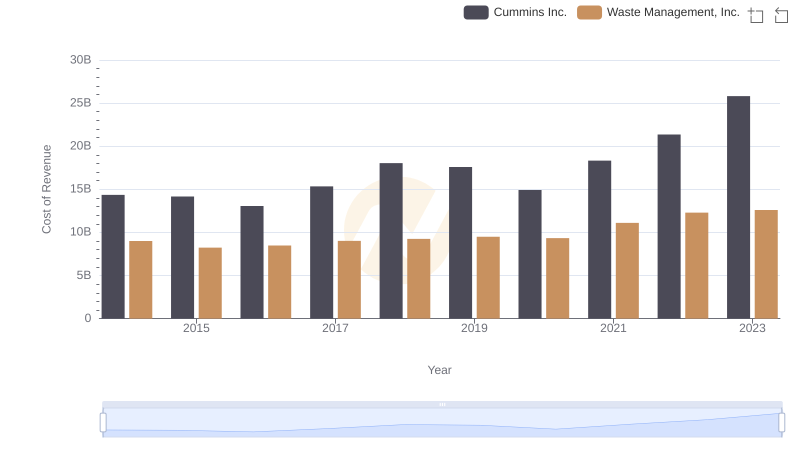
Waste Management, Inc. vs Cummins Inc.: Efficiency in Cost of Revenue Explored

Analyzing Cost of Revenue: Waste Management, Inc. and Axon Enterprise, Inc.
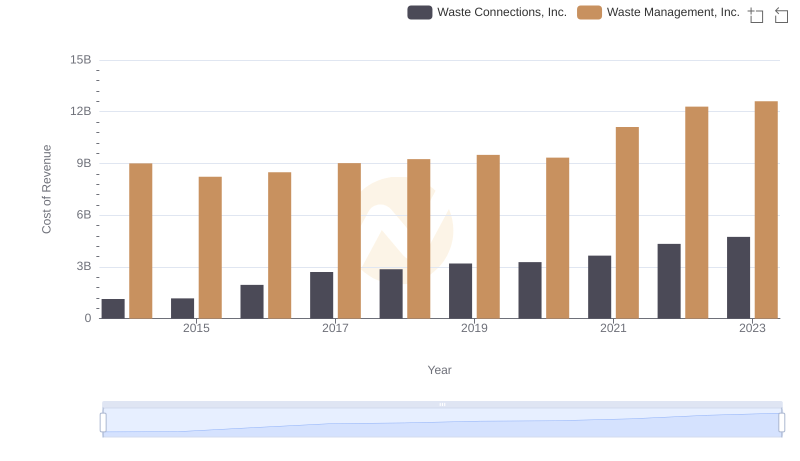
Waste Management, Inc. vs Waste Connections, Inc.: Efficiency in Cost of Revenue Explored
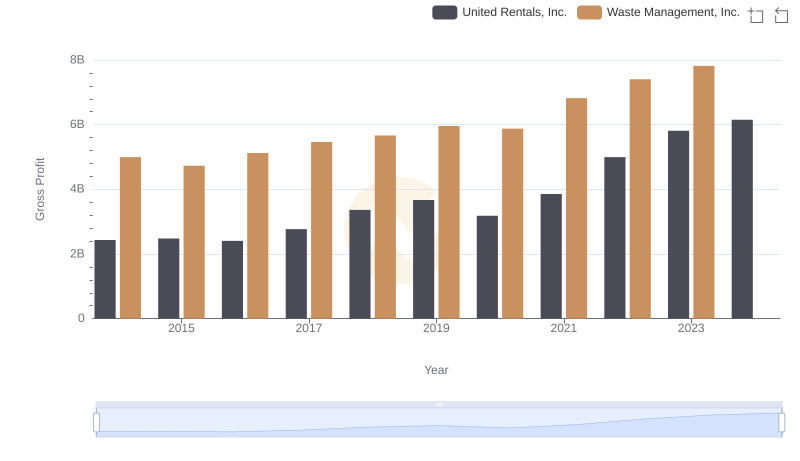
Who Generates Higher Gross Profit? Waste Management, Inc. or United Rentals, Inc.
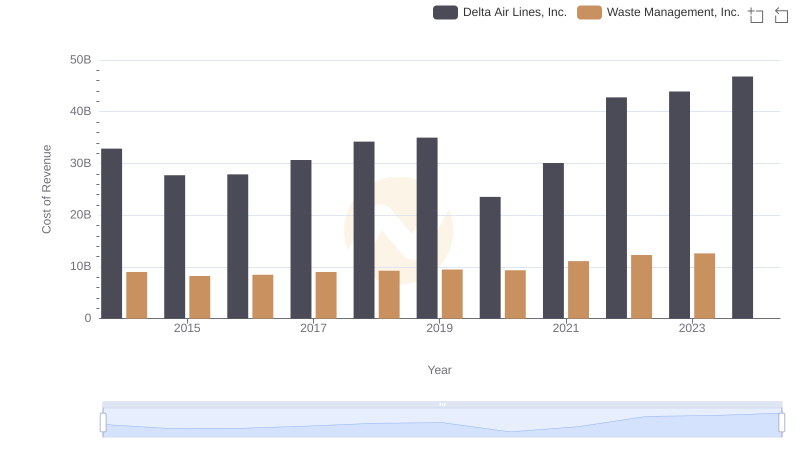
Cost of Revenue: Key Insights for Waste Management, Inc. and Delta Air Lines, Inc.
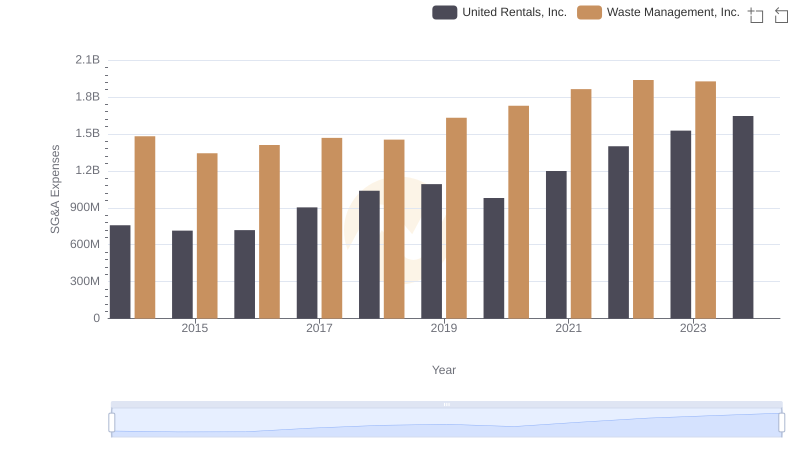
Selling, General, and Administrative Costs: Waste Management, Inc. vs United Rentals, Inc.
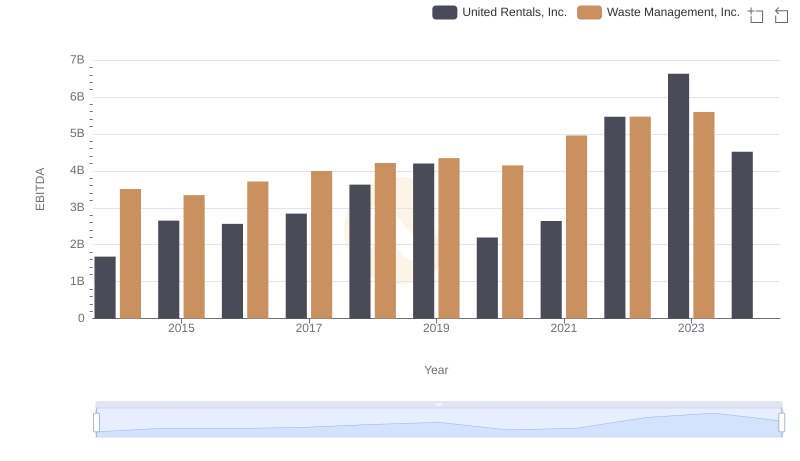
Comprehensive EBITDA Comparison: Waste Management, Inc. vs United Rentals, Inc.