| __timestamp | Hubbell Incorporated | Waste Management, Inc. |
|---|---|---|
| Wednesday, January 1, 2014 | 3359400000 | 13996000000 |
| Thursday, January 1, 2015 | 3390400000 | 12961000000 |
| Friday, January 1, 2016 | 3505200000 | 13609000000 |
| Sunday, January 1, 2017 | 3668800000 | 14485000000 |
| Monday, January 1, 2018 | 4481700000 | 14914000000 |
| Tuesday, January 1, 2019 | 4591000000 | 15455000000 |
| Wednesday, January 1, 2020 | 4186000000 | 15218000000 |
| Friday, January 1, 2021 | 4194100000 | 17931000000 |
| Saturday, January 1, 2022 | 4947900000 | 19698000000 |
| Sunday, January 1, 2023 | 5372900000 | 20426000000 |
| Monday, January 1, 2024 | 5628500000 | 22063000000 |
Igniting the spark of knowledge
In the ever-evolving landscape of American industry, Waste Management, Inc. and Hubbell Incorporated stand as titans in their respective fields. Over the past decade, these companies have demonstrated remarkable resilience and growth. From 2014 to 2023, Waste Management, Inc. saw its annual revenue soar by approximately 46%, reaching over $20 billion. This growth underscores the increasing importance of sustainable waste solutions in a world grappling with environmental challenges.
Meanwhile, Hubbell Incorporated, a leader in electrical and utility solutions, experienced a robust 60% increase in revenue, highlighting the rising demand for infrastructure and energy solutions. By 2023, Hubbell's revenue approached $5.4 billion, reflecting its strategic expansions and innovations.
This comparative analysis not only showcases the financial prowess of these companies but also offers insights into broader economic trends shaping the future of industry in the United States.

Breaking Down Revenue Trends: Waste Management, Inc. vs Lennox International Inc.
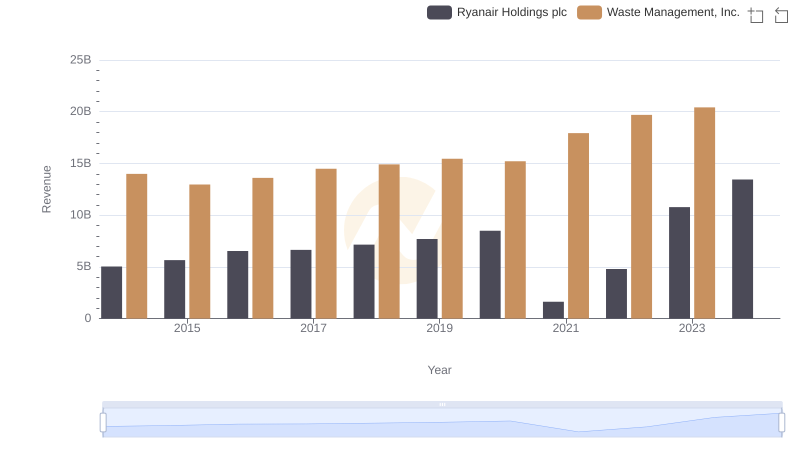
Waste Management, Inc. or Ryanair Holdings plc: Who Leads in Yearly Revenue?
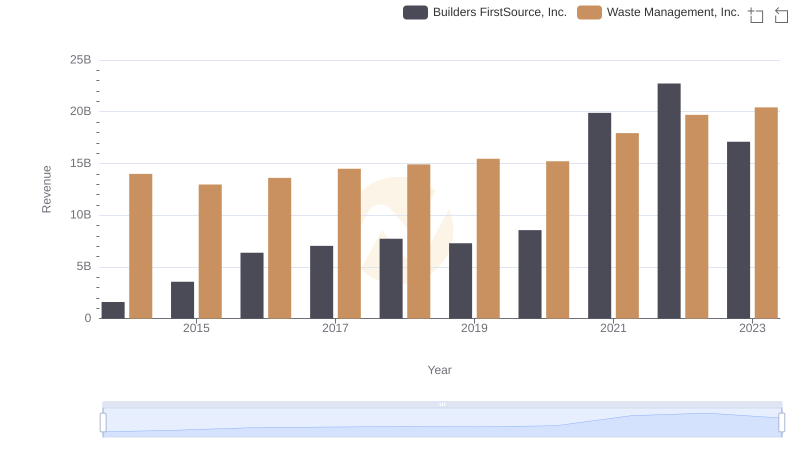
Breaking Down Revenue Trends: Waste Management, Inc. vs Builders FirstSource, Inc.
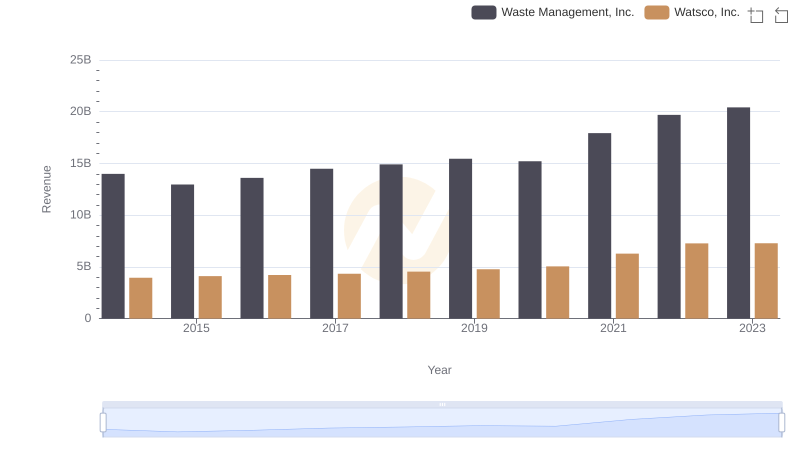
Revenue Showdown: Waste Management, Inc. vs Watsco, Inc.
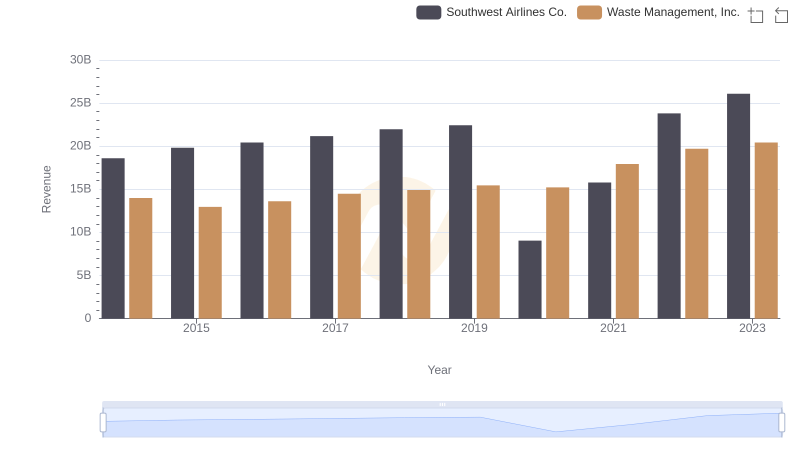
Revenue Insights: Waste Management, Inc. and Southwest Airlines Co. Performance Compared
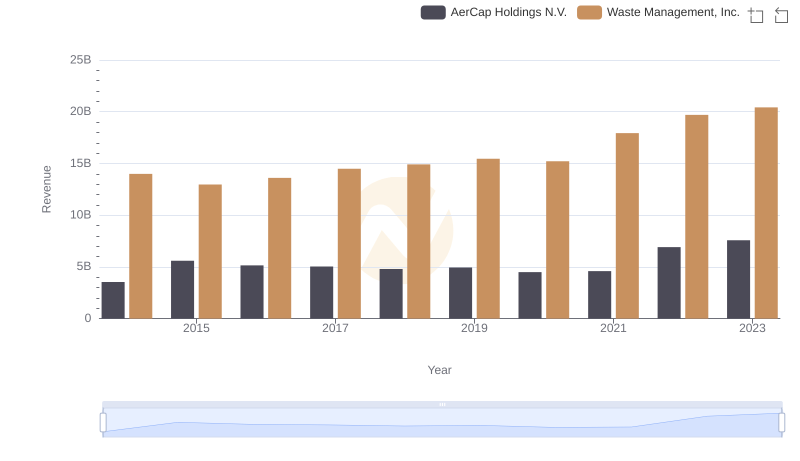
Annual Revenue Comparison: Waste Management, Inc. vs AerCap Holdings N.V.
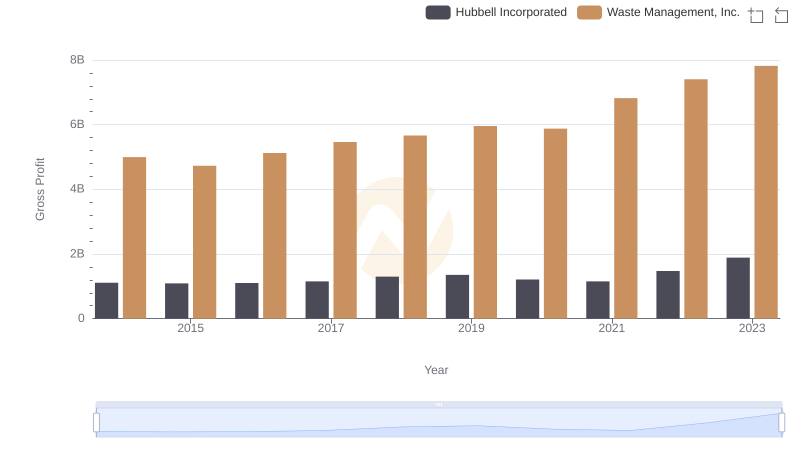
Waste Management, Inc. vs Hubbell Incorporated: A Gross Profit Performance Breakdown
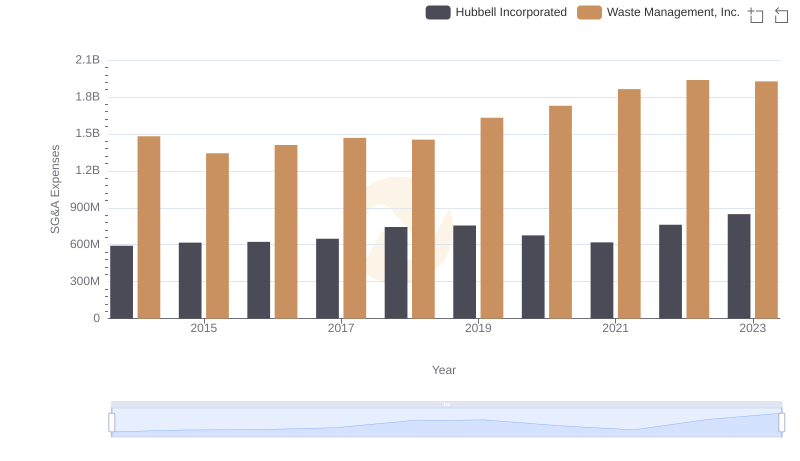
Waste Management, Inc. and Hubbell Incorporated: SG&A Spending Patterns Compared