| __timestamp | United Rentals, Inc. | Waste Management, Inc. |
|---|---|---|
| Wednesday, January 1, 2014 | 758000000 | 1481000000 |
| Thursday, January 1, 2015 | 714000000 | 1343000000 |
| Friday, January 1, 2016 | 719000000 | 1410000000 |
| Sunday, January 1, 2017 | 903000000 | 1468000000 |
| Monday, January 1, 2018 | 1038000000 | 1453000000 |
| Tuesday, January 1, 2019 | 1092000000 | 1631000000 |
| Wednesday, January 1, 2020 | 979000000 | 1728000000 |
| Friday, January 1, 2021 | 1199000000 | 1864000000 |
| Saturday, January 1, 2022 | 1400000000 | 1938000000 |
| Sunday, January 1, 2023 | 1527000000 | 1926000000 |
| Monday, January 1, 2024 | 1645000000 | 2264000000 |
Unleashing the power of data
In the ever-evolving landscape of corporate finance, understanding the nuances of Selling, General, and Administrative (SG&A) expenses is crucial. Over the past decade, Waste Management, Inc. and United Rentals, Inc. have showcased distinct trajectories in their SG&A expenditures.
From 2014 to 2023, Waste Management, Inc. consistently reported higher SG&A costs, peaking in 2022 with a 31% increase from 2014. In contrast, United Rentals, Inc. demonstrated a more dynamic growth, with a staggering 130% rise in SG&A expenses over the same period, reaching its zenith in 2024.
This divergence highlights the strategic differences between the two industry giants. While Waste Management, Inc. maintained a steady approach, United Rentals, Inc. aggressively expanded its operational footprint. Notably, data for Waste Management, Inc. in 2024 remains unavailable, leaving room for speculation on its future financial strategies.
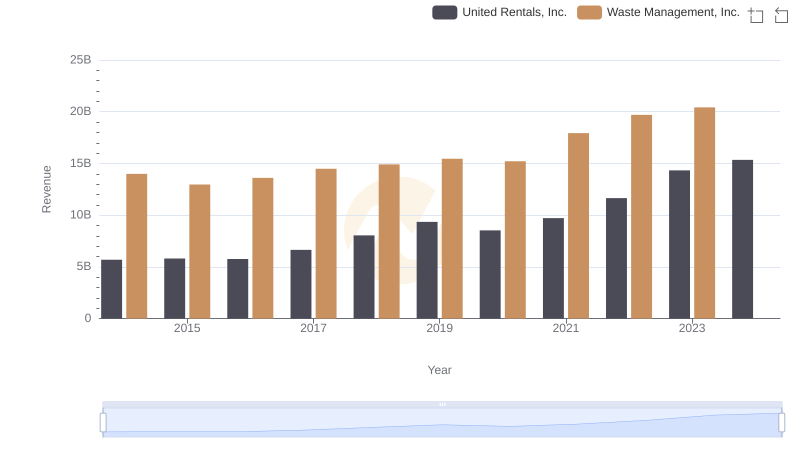
Annual Revenue Comparison: Waste Management, Inc. vs United Rentals, Inc.
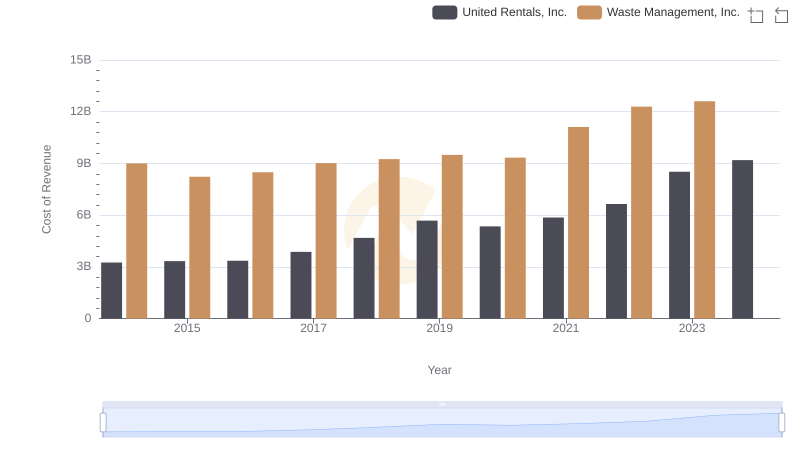
Analyzing Cost of Revenue: Waste Management, Inc. and United Rentals, Inc.
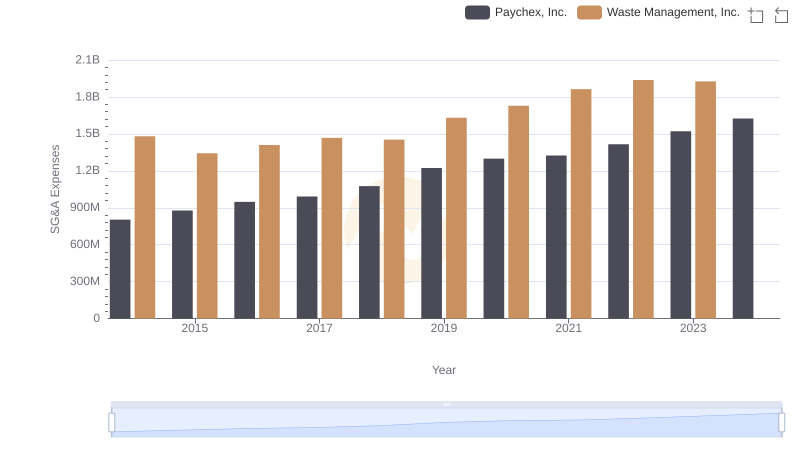
Waste Management, Inc. or Paychex, Inc.: Who Manages SG&A Costs Better?
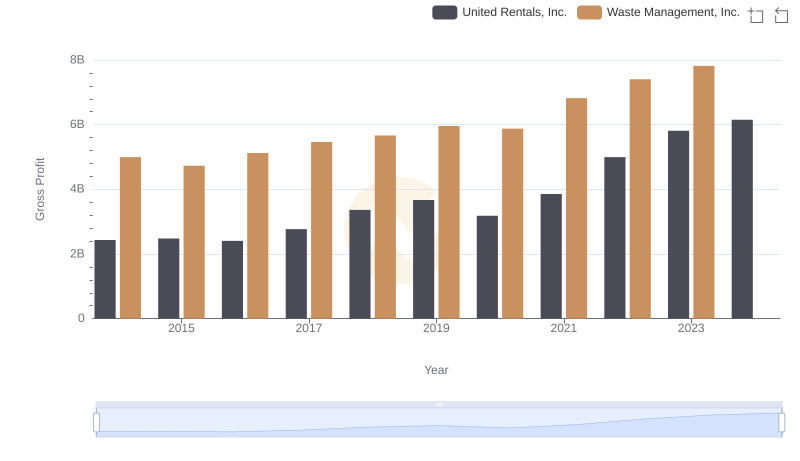
Who Generates Higher Gross Profit? Waste Management, Inc. or United Rentals, Inc.
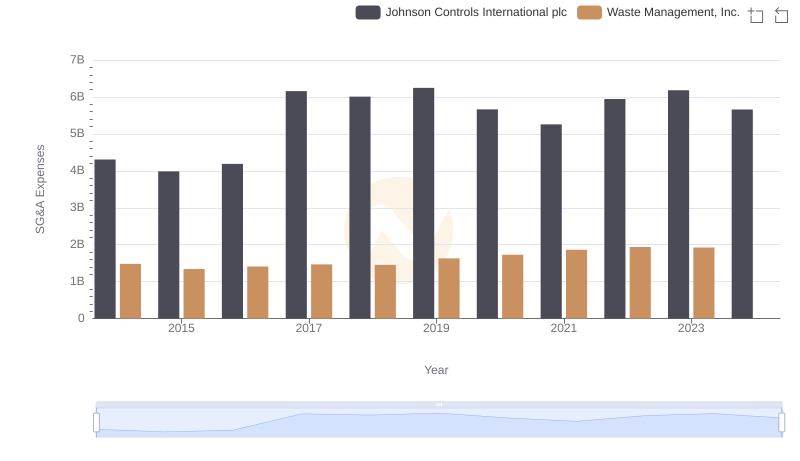
Waste Management, Inc. and Johnson Controls International plc: SG&A Spending Patterns Compared
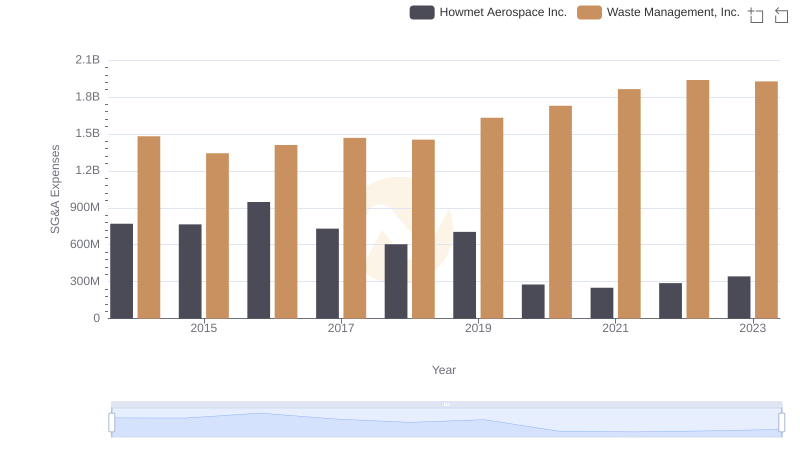
Cost Management Insights: SG&A Expenses for Waste Management, Inc. and Howmet Aerospace Inc.
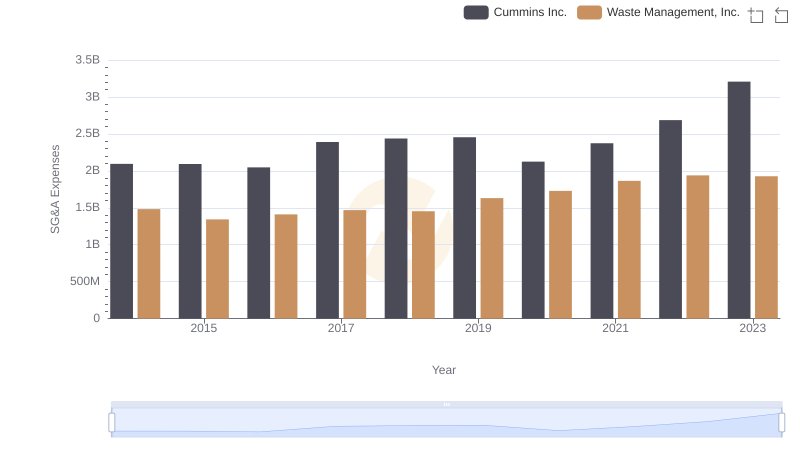
Breaking Down SG&A Expenses: Waste Management, Inc. vs Cummins Inc.
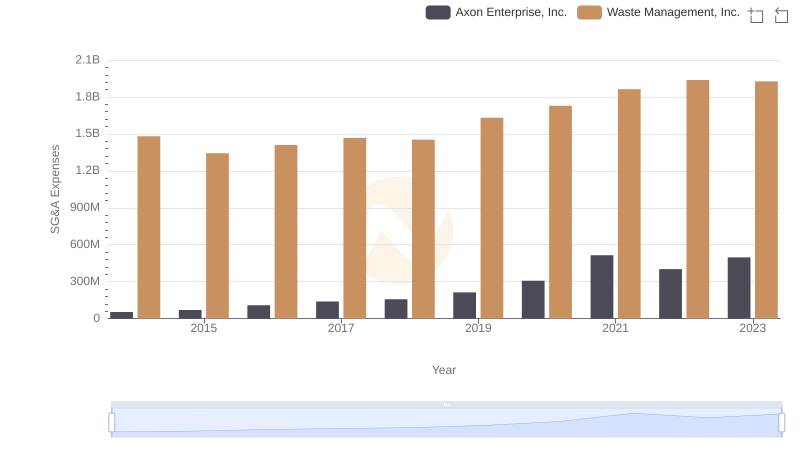
Who Optimizes SG&A Costs Better? Waste Management, Inc. or Axon Enterprise, Inc.
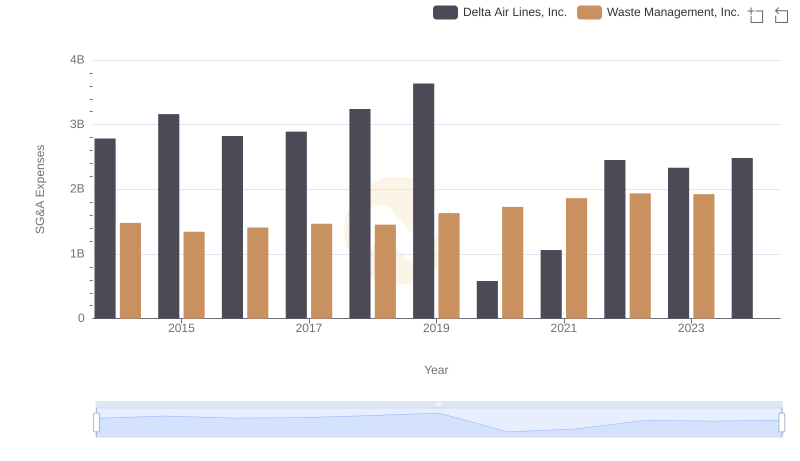
Waste Management, Inc. or Delta Air Lines, Inc.: Who Manages SG&A Costs Better?
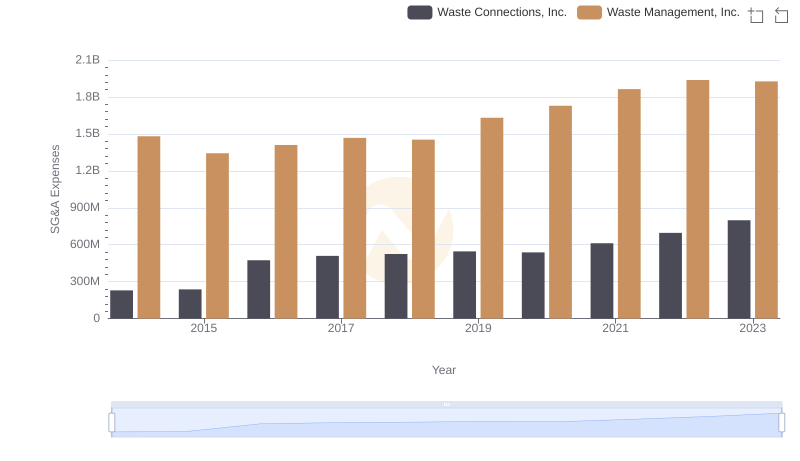
SG&A Efficiency Analysis: Comparing Waste Management, Inc. and Waste Connections, Inc.
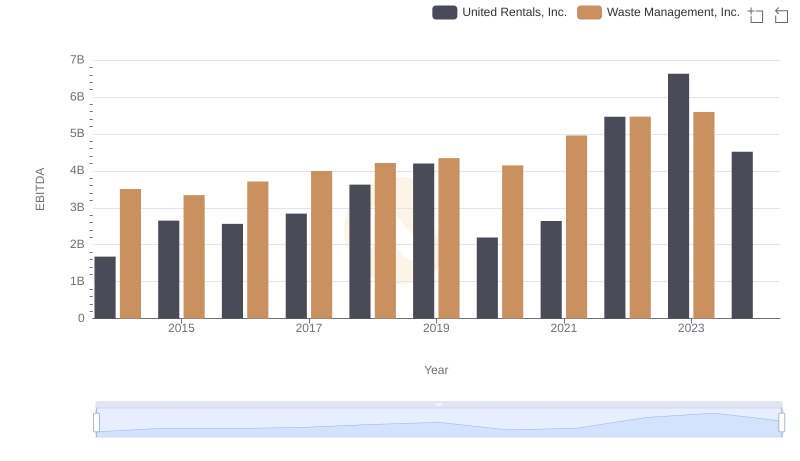
Comprehensive EBITDA Comparison: Waste Management, Inc. vs United Rentals, Inc.
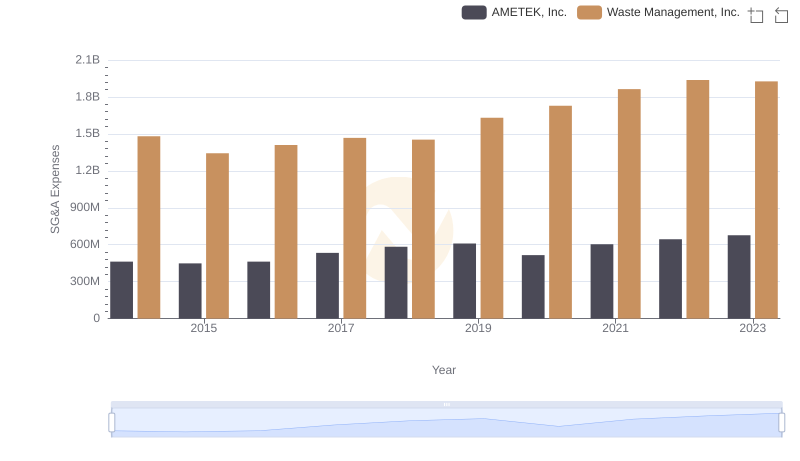
SG&A Efficiency Analysis: Comparing Waste Management, Inc. and AMETEK, Inc.