| __timestamp | Ferrovial SE | Waste Connections, Inc. |
|---|---|---|
| Wednesday, January 1, 2014 | 8802000000 | 2079166000 |
| Thursday, January 1, 2015 | 9699000000 | 2117287000 |
| Friday, January 1, 2016 | 10758000000 | 3375863000 |
| Sunday, January 1, 2017 | 12209000000 | 4630488000 |
| Monday, January 1, 2018 | 5737000000 | 4922941000 |
| Tuesday, January 1, 2019 | 6054000000 | 5388679000 |
| Wednesday, January 1, 2020 | 6341000000 | 5445990000 |
| Friday, January 1, 2021 | 6778000000 | 6151361000 |
| Saturday, January 1, 2022 | 7551000000 | 7211859000 |
| Sunday, January 1, 2023 | 8514000000 | 8021951000 |
| Monday, January 1, 2024 | 8919591000 |
Unleashing insights
In the ever-evolving landscape of global waste management, two giants, Waste Connections, Inc. and Ferrovial SE, have been vying for dominance. Over the past decade, from 2014 to 2023, these companies have showcased remarkable revenue trajectories. Ferrovial SE, a Spanish multinational, initially led the race with a revenue peak in 2017, but faced a downturn in 2018, dropping by over 50%. Meanwhile, Waste Connections, Inc., a North American leader, steadily climbed the revenue ladder, achieving a growth of nearly 286% from 2014 to 2023. By 2023, Waste Connections, Inc. closed the gap, reaching 94% of Ferrovial SE's revenue. This rivalry highlights the dynamic shifts in the waste management sector, driven by strategic expansions and market adaptations. As the industry continues to grow, these companies remain pivotal players, shaping the future of sustainable waste solutions.
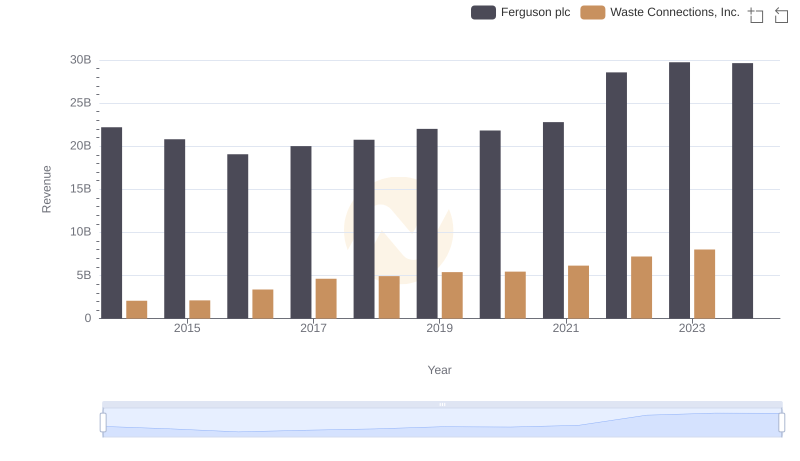
Comparing Revenue Performance: Waste Connections, Inc. or Ferguson plc?
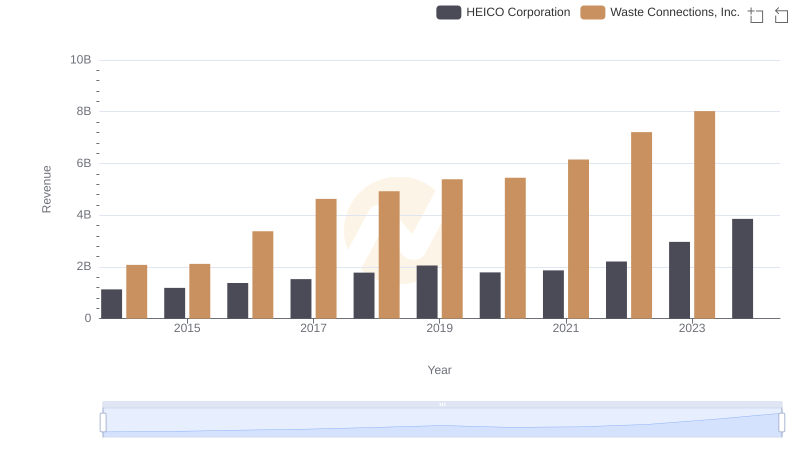
Waste Connections, Inc. vs HEICO Corporation: Examining Key Revenue Metrics
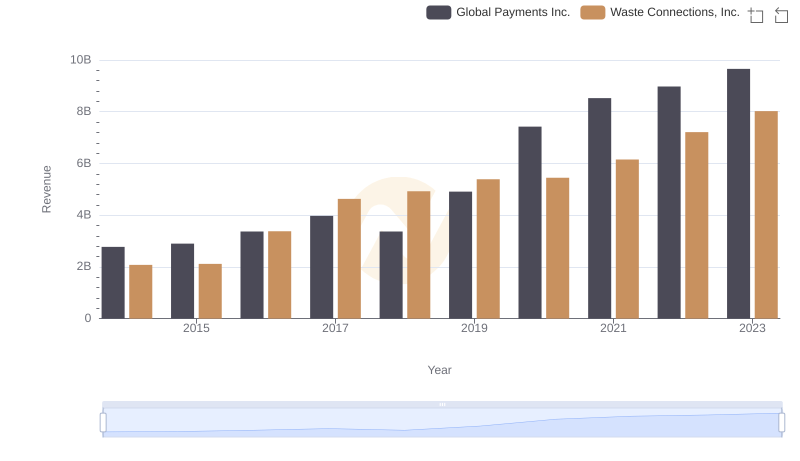
Breaking Down Revenue Trends: Waste Connections, Inc. vs Global Payments Inc.
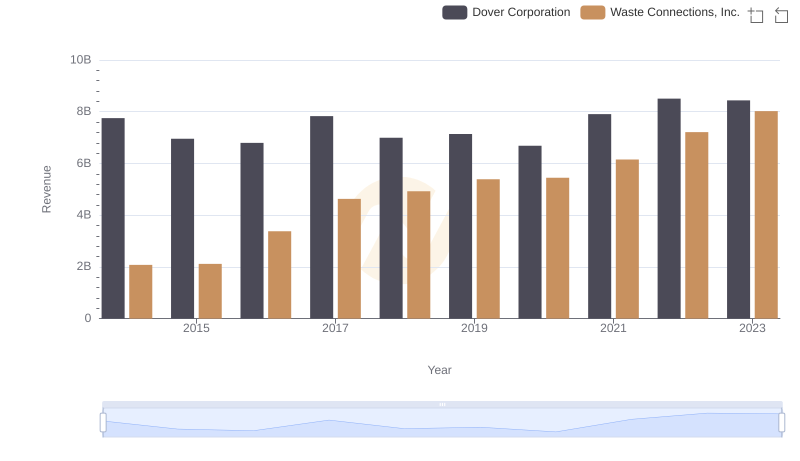
Revenue Showdown: Waste Connections, Inc. vs Dover Corporation

Waste Connections, Inc. vs Ferrovial SE: A Gross Profit Performance Breakdown
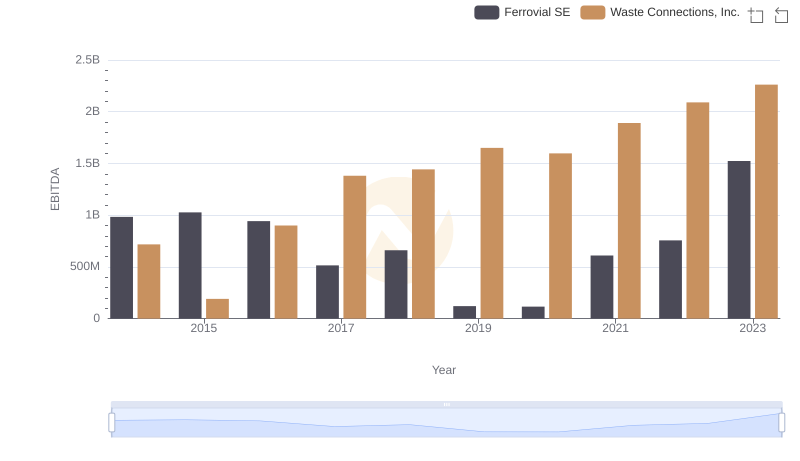
EBITDA Performance Review: Waste Connections, Inc. vs Ferrovial SE