| __timestamp | Textron Inc. | Waste Connections, Inc. |
|---|---|---|
| Wednesday, January 1, 2014 | 2457000000 | 940778000 |
| Thursday, January 1, 2015 | 2444000000 | 939878000 |
| Friday, January 1, 2016 | 2477000000 | 1418151000 |
| Sunday, January 1, 2017 | 2403000000 | 1925713000 |
| Monday, January 1, 2018 | 2378000000 | 2057237000 |
| Tuesday, January 1, 2019 | 2224000000 | 2189922000 |
| Wednesday, January 1, 2020 | 1557000000 | 2169182000 |
| Friday, January 1, 2021 | 2085000000 | 2497287000 |
| Saturday, January 1, 2022 | 2069000000 | 2875847000 |
| Sunday, January 1, 2023 | 2278000000 | 3277438000 |
| Monday, January 1, 2024 | 2502000000 | 3727885000 |
Unveiling the hidden dimensions of data
In the ever-evolving landscape of corporate profitability, Waste Connections, Inc. and Textron Inc. have showcased intriguing trends over the past decade. From 2014 to 2023, Waste Connections, Inc. has seen a remarkable growth in gross profit, surging by approximately 248% from 2014 to 2023. This growth trajectory highlights the company's strategic prowess in the waste management sector. In contrast, Textron Inc., a diversified industrial conglomerate, experienced a more volatile journey. Despite a dip in 2020, Textron's gross profit rebounded by 46% in 2023, reflecting resilience amidst economic challenges. Notably, 2024 data for Waste Connections, Inc. remains elusive, leaving room for speculation. As these industry titans continue to navigate their respective markets, stakeholders and investors are keenly observing their financial maneuvers. This comparison not only underscores the dynamic nature of corporate growth but also offers valuable insights into sector-specific strategies.
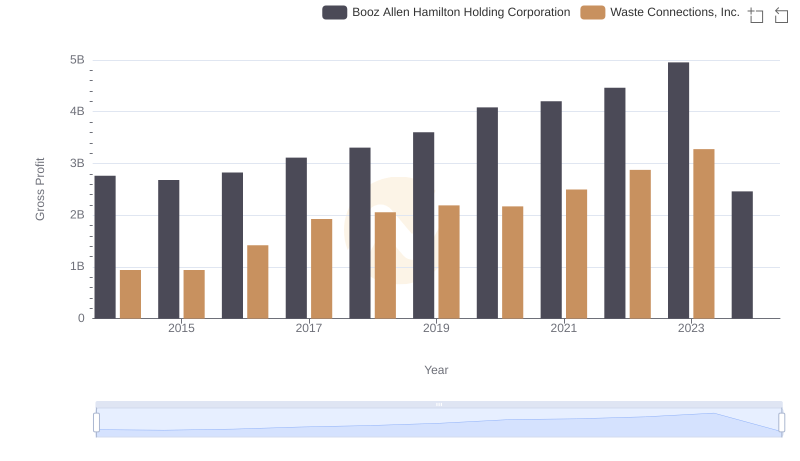
Gross Profit Comparison: Waste Connections, Inc. and Booz Allen Hamilton Holding Corporation Trends
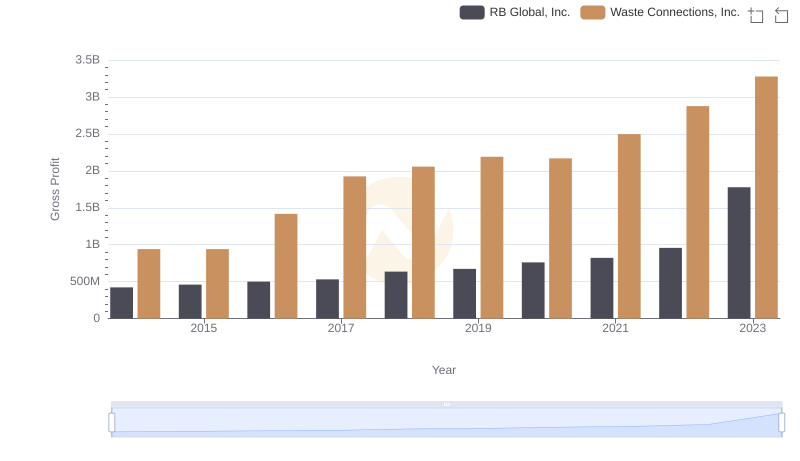
Waste Connections, Inc. and RB Global, Inc.: A Detailed Gross Profit Analysis
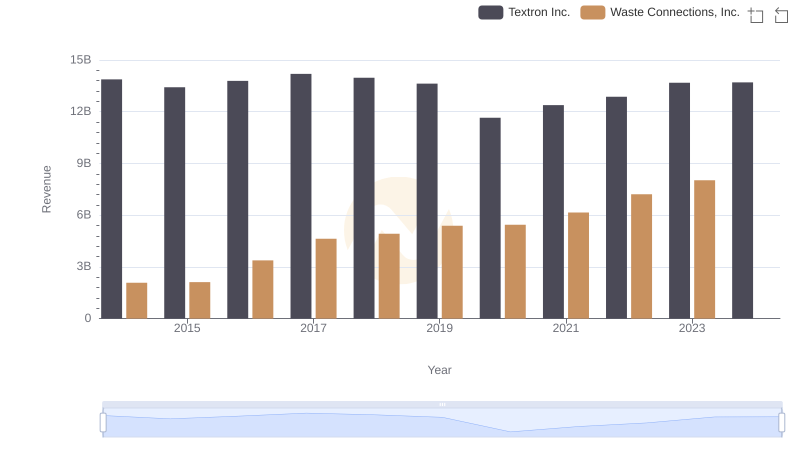
Waste Connections, Inc. and Textron Inc.: A Comprehensive Revenue Analysis
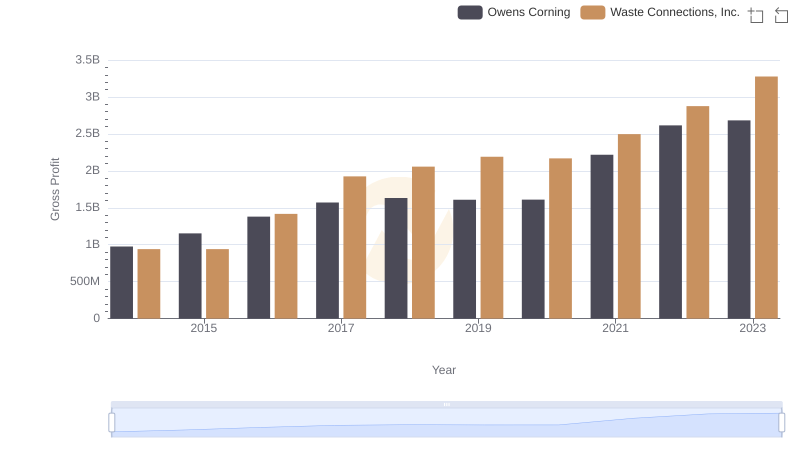
Who Generates Higher Gross Profit? Waste Connections, Inc. or Owens Corning
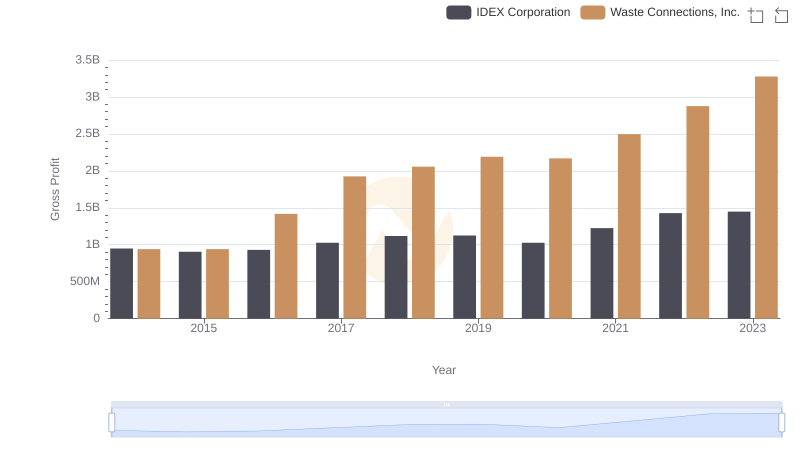
Gross Profit Comparison: Waste Connections, Inc. and IDEX Corporation Trends
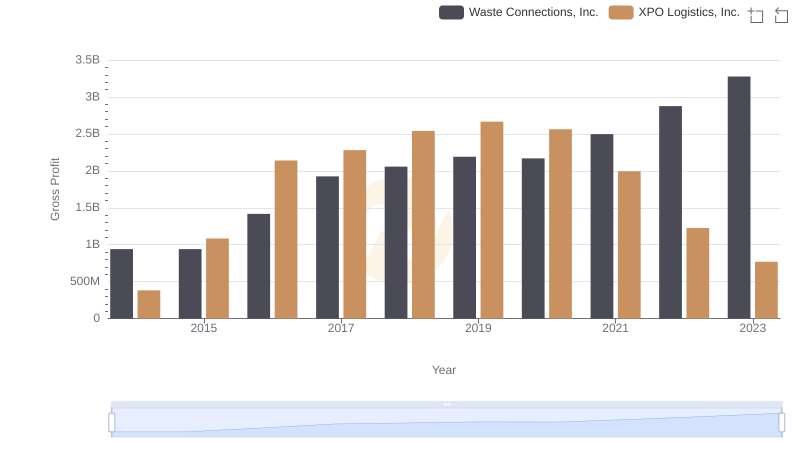
Who Generates Higher Gross Profit? Waste Connections, Inc. or XPO Logistics, Inc.
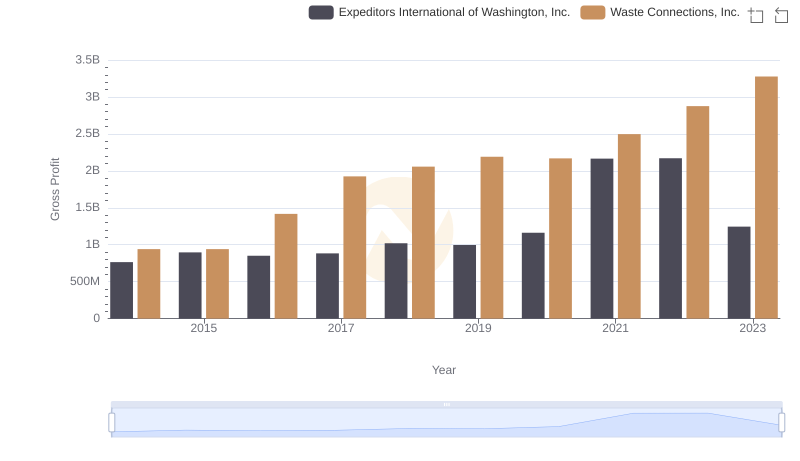
Gross Profit Trends Compared: Waste Connections, Inc. vs Expeditors International of Washington, Inc.
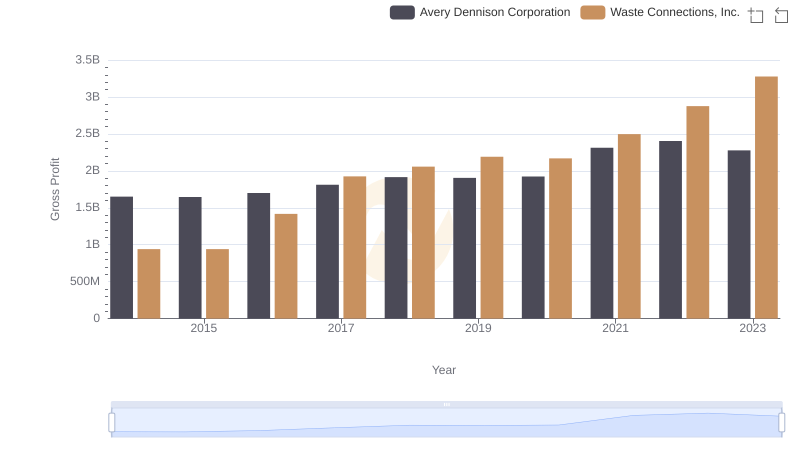
Gross Profit Comparison: Waste Connections, Inc. and Avery Dennison Corporation Trends
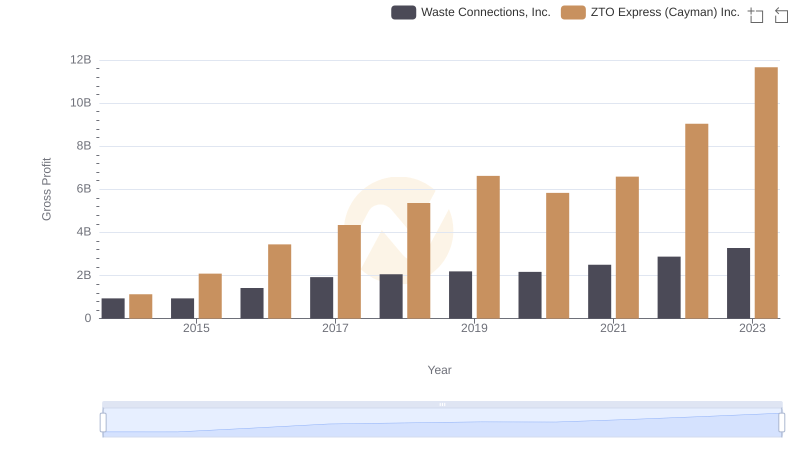
Waste Connections, Inc. vs ZTO Express (Cayman) Inc.: A Gross Profit Performance Breakdown
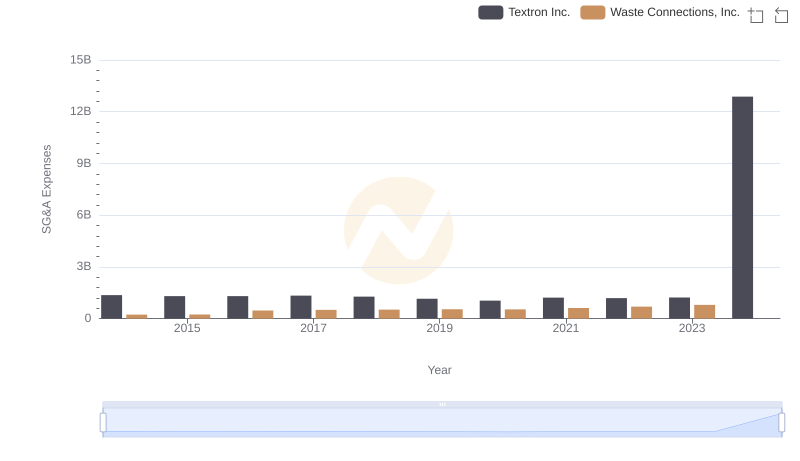
Breaking Down SG&A Expenses: Waste Connections, Inc. vs Textron Inc.
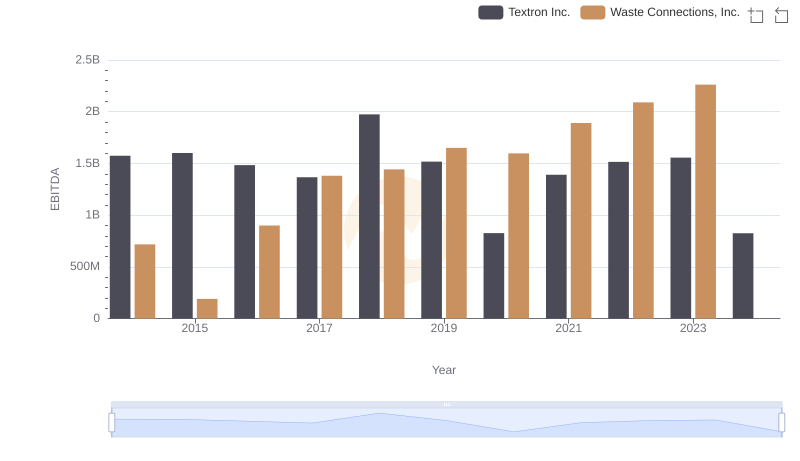
Waste Connections, Inc. and Textron Inc.: A Detailed Examination of EBITDA Performance