| __timestamp | U-Haul Holding Company | Waste Connections, Inc. |
|---|---|---|
| Wednesday, January 1, 2014 | 2707982000 | 940778000 |
| Thursday, January 1, 2015 | 2928459000 | 939878000 |
| Friday, January 1, 2016 | 3130666000 | 1418151000 |
| Sunday, January 1, 2017 | 3269282000 | 1925713000 |
| Monday, January 1, 2018 | 3440625000 | 2057237000 |
| Tuesday, January 1, 2019 | 3606565000 | 2189922000 |
| Wednesday, January 1, 2020 | 3814850000 | 2169182000 |
| Friday, January 1, 2021 | 4327926000 | 2497287000 |
| Saturday, January 1, 2022 | 5480162000 | 2875847000 |
| Sunday, January 1, 2023 | 5019797000 | 3277438000 |
| Monday, January 1, 2024 | 1649634000 | 3727885000 |
Unveiling the hidden dimensions of data
In the ever-evolving landscape of corporate finance, understanding gross profit trends is crucial for investors and stakeholders. This analysis delves into the financial trajectories of Waste Connections, Inc. and U-Haul Holding Company from 2014 to 2023. Over this period, U-Haul Holding Company demonstrated a robust growth trajectory, with gross profits peaking in 2022 at approximately 5.5 billion, marking a 102% increase from 2014. In contrast, Waste Connections, Inc. showed a steady upward trend, culminating in a gross profit of around 3.3 billion in 2023, a 248% rise since 2014. Notably, 2024 data for Waste Connections, Inc. is unavailable, highlighting potential data gaps. This comparative insight underscores the dynamic nature of these industries, offering a window into their financial health and strategic positioning.
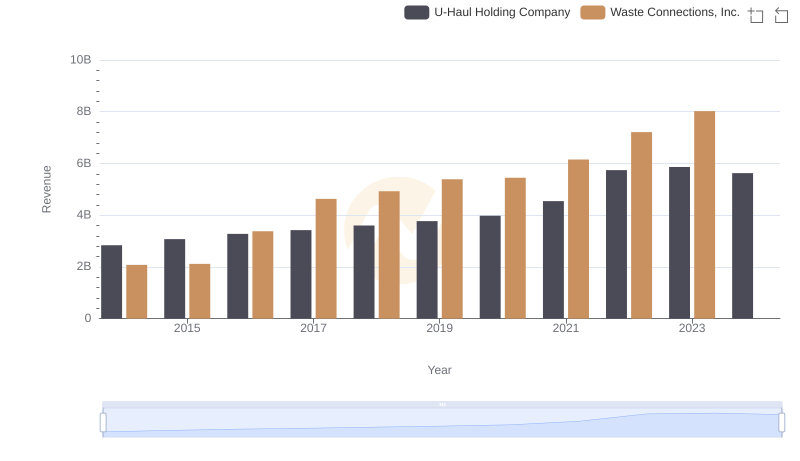
Comparing Revenue Performance: Waste Connections, Inc. or U-Haul Holding Company?
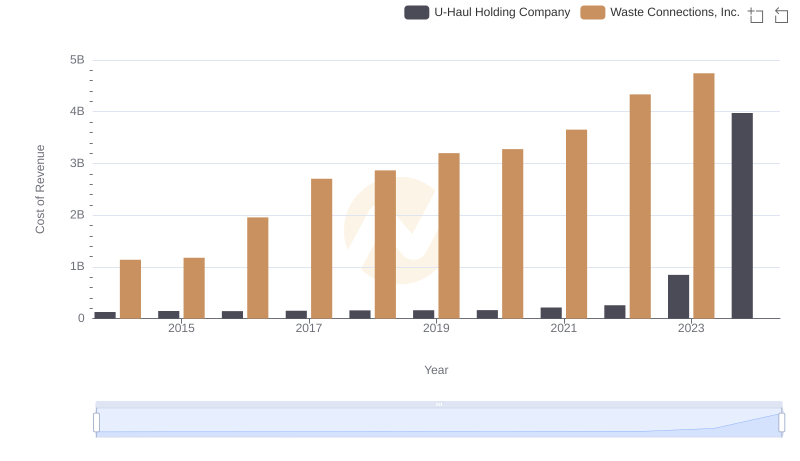
Cost of Revenue Trends: Waste Connections, Inc. vs U-Haul Holding Company

Key Insights on Gross Profit: Waste Connections, Inc. vs Pool Corporation

Waste Connections, Inc. and AECOM: A Detailed Gross Profit Analysis
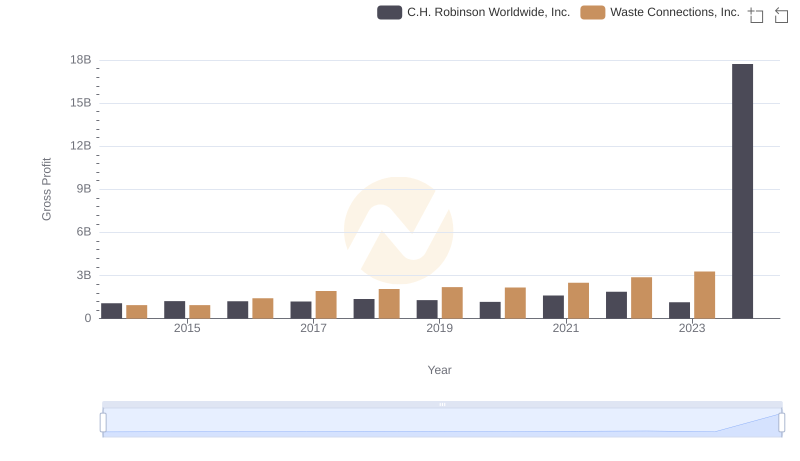
Key Insights on Gross Profit: Waste Connections, Inc. vs C.H. Robinson Worldwide, Inc.
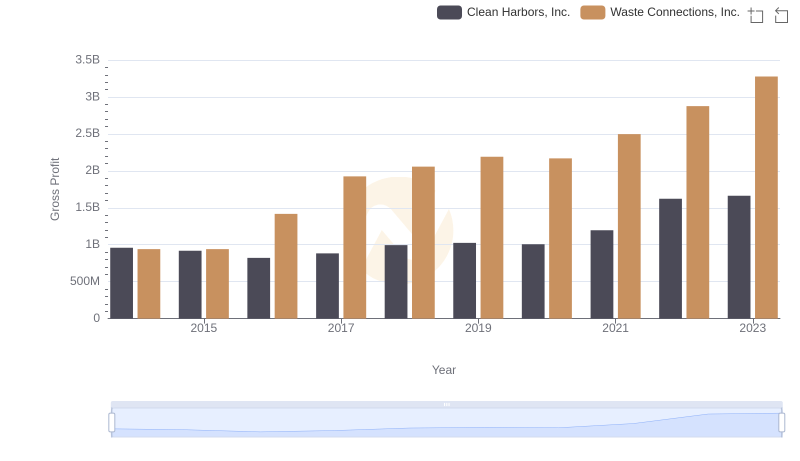
Waste Connections, Inc. and Clean Harbors, Inc.: A Detailed Gross Profit Analysis
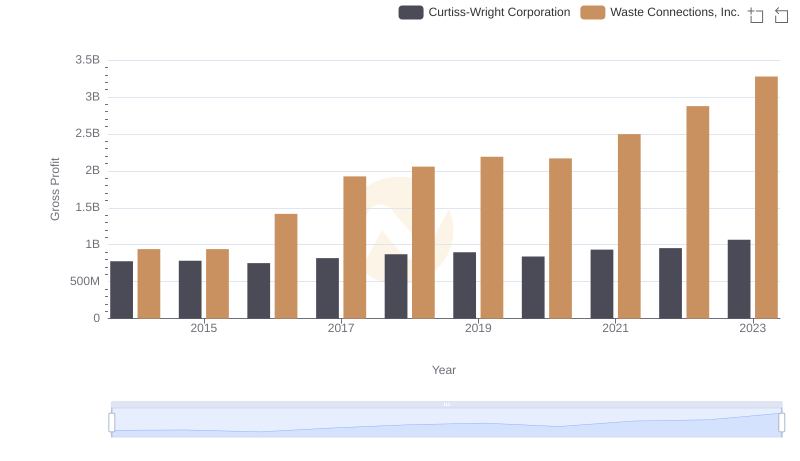
Gross Profit Trends Compared: Waste Connections, Inc. vs Curtiss-Wright Corporation
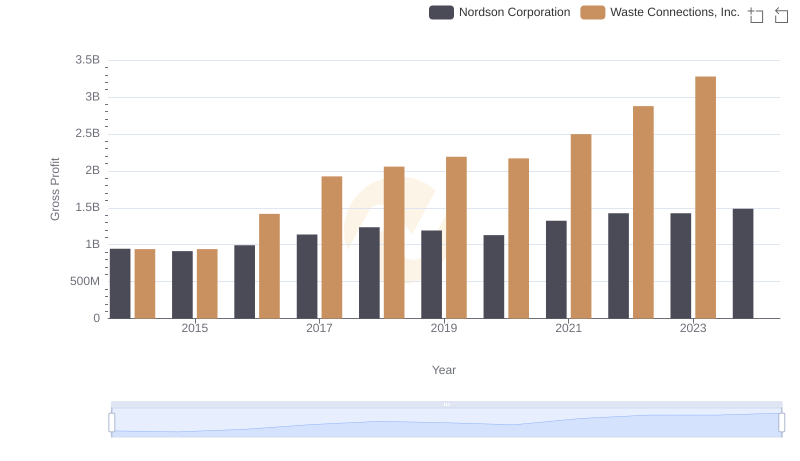
Gross Profit Comparison: Waste Connections, Inc. and Nordson Corporation Trends