| __timestamp | CSX Corporation | Union Pacific Corporation |
|---|---|---|
| Wednesday, January 1, 2014 | 4740000000 | 10808000000 |
| Thursday, January 1, 2015 | 4890000000 | 10290000000 |
| Friday, January 1, 2016 | 4640000000 | 9502000000 |
| Sunday, January 1, 2017 | 5113000000 | 10456000000 |
| Monday, January 1, 2018 | 6274000000 | 10802000000 |
| Tuesday, January 1, 2019 | 6402000000 | 11013000000 |
| Wednesday, January 1, 2020 | 5764000000 | 10331000000 |
| Friday, January 1, 2021 | 6653000000 | 11843000000 |
| Saturday, January 1, 2022 | 7390000000 | 12636000000 |
| Sunday, January 1, 2023 | 7340000000 | 11928000000 |
| Monday, January 1, 2024 | 12461000000 |
Unleashing insights
Since 2014, the financial landscape of the American railroad industry has been marked by the robust performance of two giants: Union Pacific Corporation and CSX Corporation. Over the past decade, Union Pacific has consistently outperformed CSX in terms of EBITDA, showcasing a strong financial backbone. In 2022, Union Pacific's EBITDA was approximately 71% higher than CSX's, highlighting its dominant market position. However, CSX has shown impressive growth, with a 59% increase in EBITDA from 2014 to 2022. This growth trajectory underscores CSX's strategic initiatives and operational efficiencies. Notably, 2023 data reveals a slight dip for both companies, possibly indicating market challenges or strategic shifts. As we look to the future, the missing data for 2024 suggests an opportunity for both companies to redefine their strategies and continue their competitive edge in the ever-evolving transportation sector.

Union Pacific Corporation and CSX Corporation: A Comprehensive Revenue Analysis
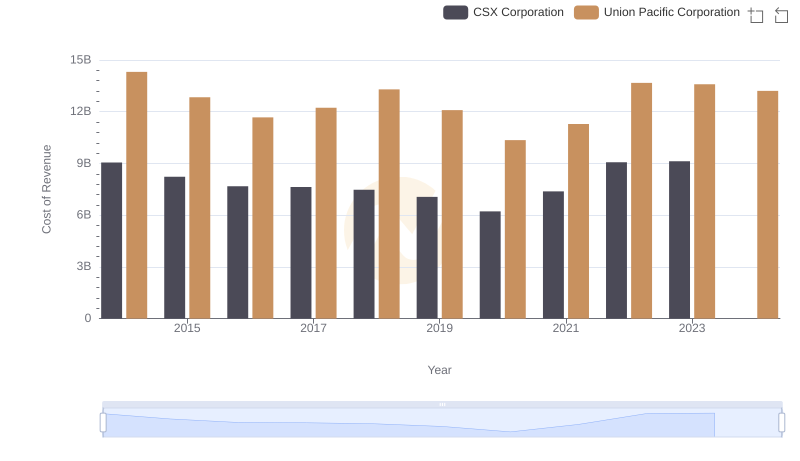
Cost of Revenue Comparison: Union Pacific Corporation vs CSX Corporation
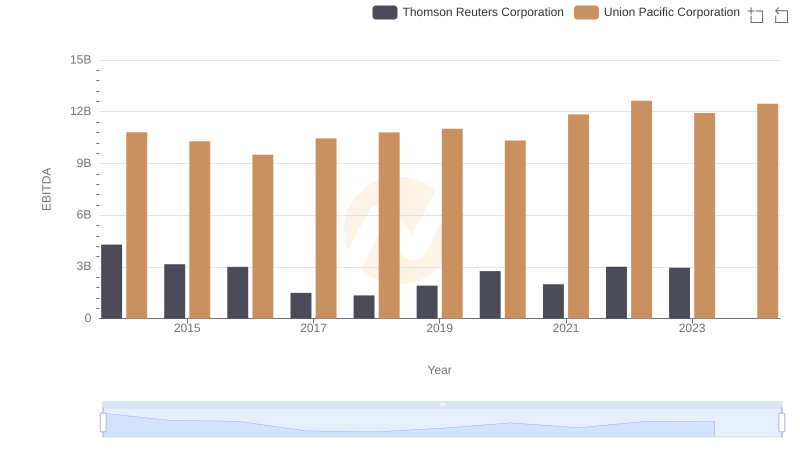
Comprehensive EBITDA Comparison: Union Pacific Corporation vs Thomson Reuters Corporation
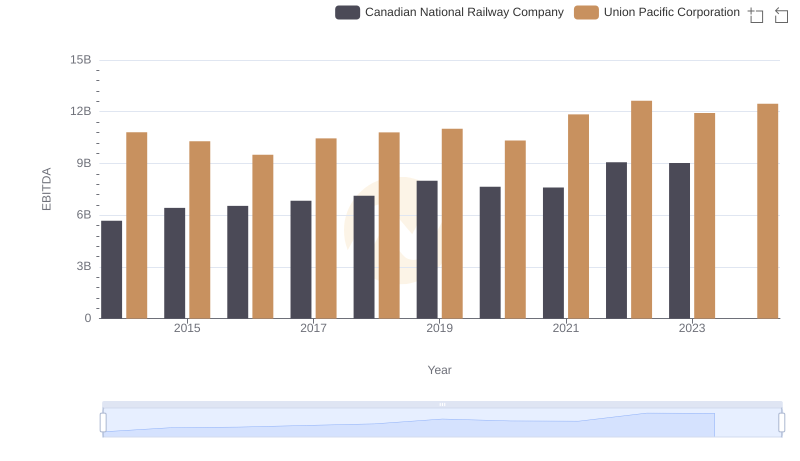
EBITDA Metrics Evaluated: Union Pacific Corporation vs Canadian National Railway Company
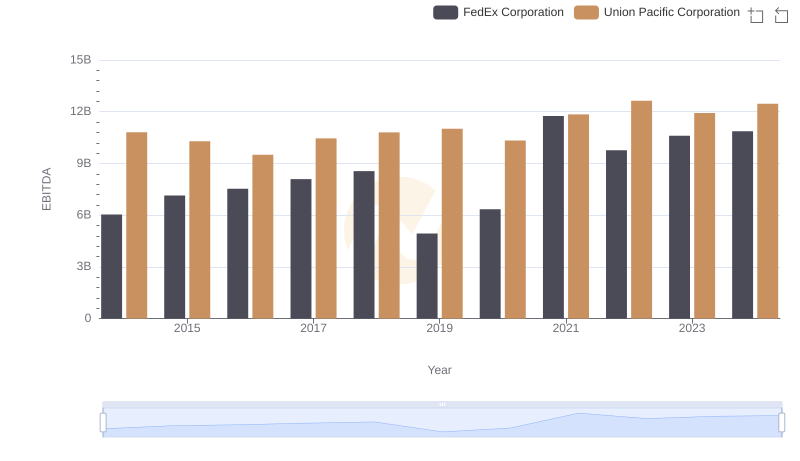
A Professional Review of EBITDA: Union Pacific Corporation Compared to FedEx Corporation
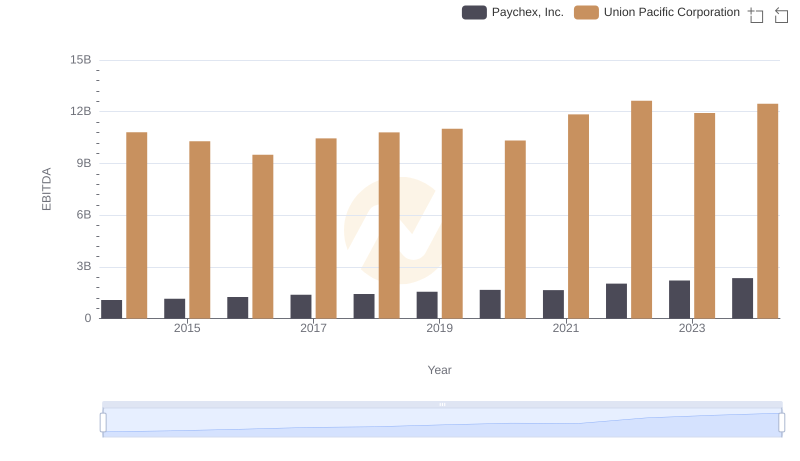
Union Pacific Corporation vs Paychex, Inc.: In-Depth EBITDA Performance Comparison
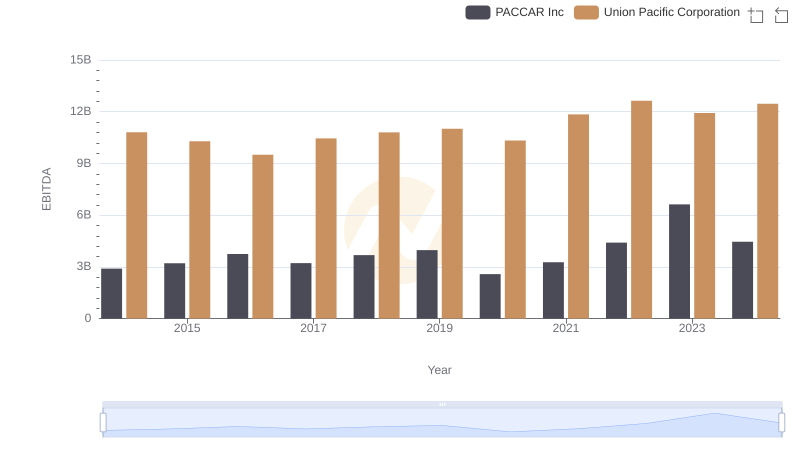
A Professional Review of EBITDA: Union Pacific Corporation Compared to PACCAR Inc