| __timestamp | FedEx Corporation | Union Pacific Corporation |
|---|---|---|
| Wednesday, January 1, 2014 | 6036000000 | 10808000000 |
| Thursday, January 1, 2015 | 7141000000 | 10290000000 |
| Friday, January 1, 2016 | 7531000000 | 9502000000 |
| Sunday, January 1, 2017 | 8093000000 | 10456000000 |
| Monday, January 1, 2018 | 8555000000 | 10802000000 |
| Tuesday, January 1, 2019 | 4934000000 | 11013000000 |
| Wednesday, January 1, 2020 | 6345000000 | 10331000000 |
| Friday, January 1, 2021 | 11749000000 | 11843000000 |
| Saturday, January 1, 2022 | 9767000000 | 12636000000 |
| Sunday, January 1, 2023 | 10603000000 | 11928000000 |
| Monday, January 1, 2024 | 10868000000 | 12461000000 |
Unveiling the hidden dimensions of data
In the ever-evolving landscape of American industry, Union Pacific Corporation and FedEx Corporation stand as titans of their respective sectors. Over the past decade, from 2014 to 2024, these giants have showcased their financial prowess through EBITDA performance. Union Pacific, a stalwart in the rail transport sector, consistently outperformed FedEx, a leader in logistics, with an average EBITDA approximately 33% higher. Notably, in 2022, Union Pacific reached its peak with an EBITDA of 12.6 billion, marking a 33% increase from its 2016 low. Meanwhile, FedEx experienced a significant rebound in 2021, achieving a 138% increase from its 2019 dip. This financial narrative underscores the resilience and strategic adaptability of these corporations amidst economic fluctuations. As we look to the future, the data suggests a promising trajectory for both companies, with Union Pacific maintaining its lead.
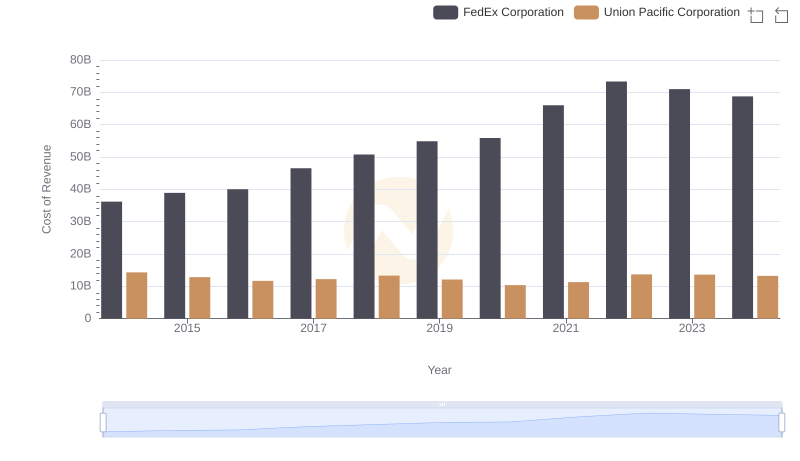
Union Pacific Corporation vs FedEx Corporation: Efficiency in Cost of Revenue Explored
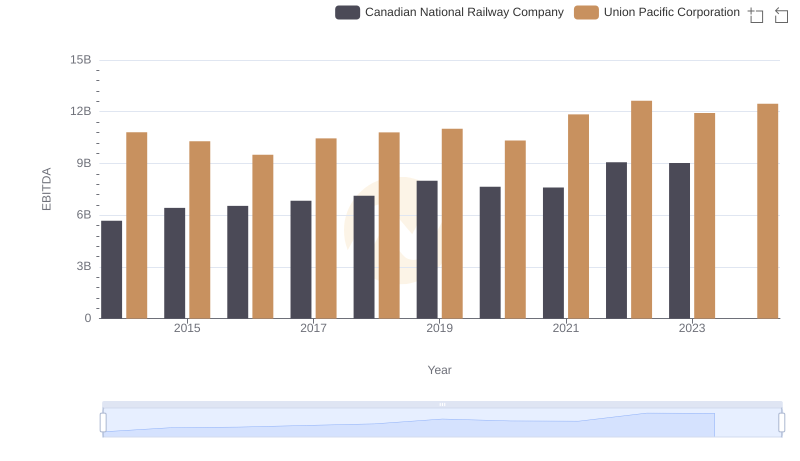
EBITDA Metrics Evaluated: Union Pacific Corporation vs Canadian National Railway Company
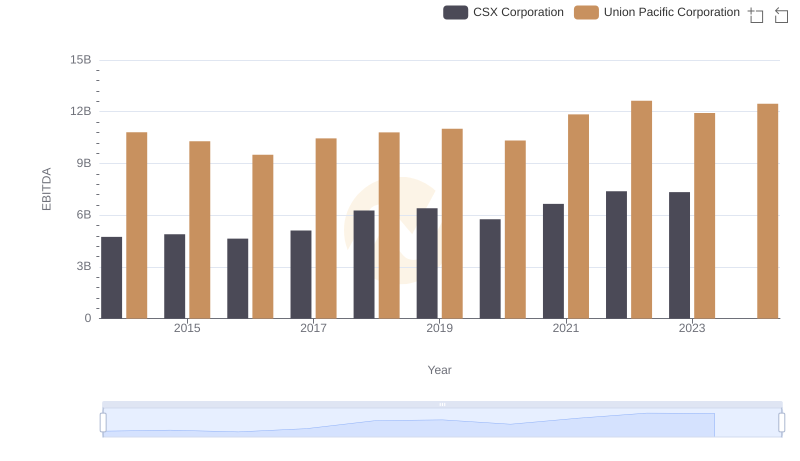
A Side-by-Side Analysis of EBITDA: Union Pacific Corporation and CSX Corporation
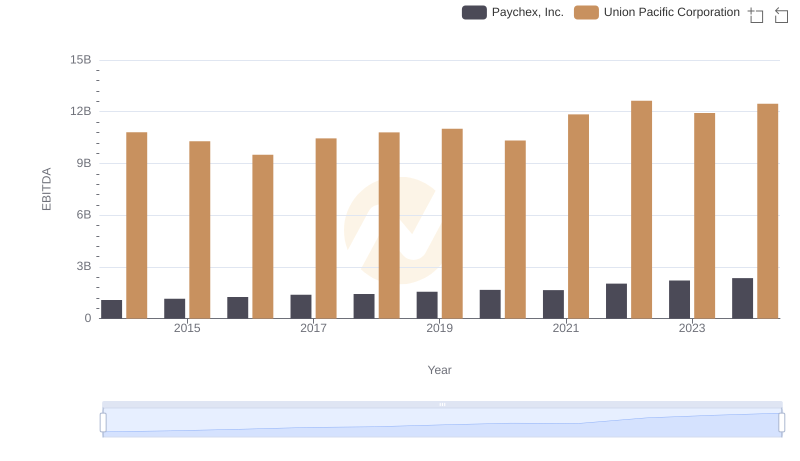
Union Pacific Corporation vs Paychex, Inc.: In-Depth EBITDA Performance Comparison
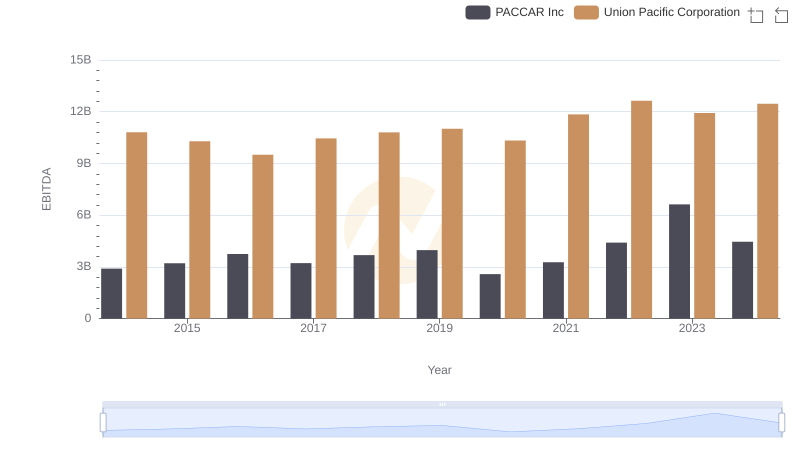
A Professional Review of EBITDA: Union Pacific Corporation Compared to PACCAR Inc