| __timestamp | Canadian National Railway Company | Union Pacific Corporation |
|---|---|---|
| Wednesday, January 1, 2014 | 5674000000 | 10808000000 |
| Thursday, January 1, 2015 | 6424000000 | 10290000000 |
| Friday, January 1, 2016 | 6537000000 | 9502000000 |
| Sunday, January 1, 2017 | 6839000000 | 10456000000 |
| Monday, January 1, 2018 | 7124000000 | 10802000000 |
| Tuesday, January 1, 2019 | 7999000000 | 11013000000 |
| Wednesday, January 1, 2020 | 7652000000 | 10331000000 |
| Friday, January 1, 2021 | 7607000000 | 11843000000 |
| Saturday, January 1, 2022 | 9067000000 | 12636000000 |
| Sunday, January 1, 2023 | 9027000000 | 11928000000 |
| Monday, January 1, 2024 | 12461000000 |
Unlocking the unknown
In the world of rail transport, Union Pacific Corporation and Canadian National Railway Company have long been titans of industry. Over the past decade, these two giants have showcased intriguing trends in their EBITDA, a key financial metric that reflects a company's operational profitability.
From 2014 to 2023, Union Pacific consistently outperformed its Canadian counterpart, with EBITDA figures peaking at approximately 12.6 billion in 2022, marking a 20% increase from 2014. Meanwhile, Canadian National Railway saw a steady rise, culminating in a 60% growth over the same period, reaching around 9 billion in 2022.
Interestingly, 2023 data reveals a slight dip for Union Pacific, while Canadian National maintained its momentum. This divergence highlights the dynamic nature of the rail industry and the varying strategies employed by these North American powerhouses.
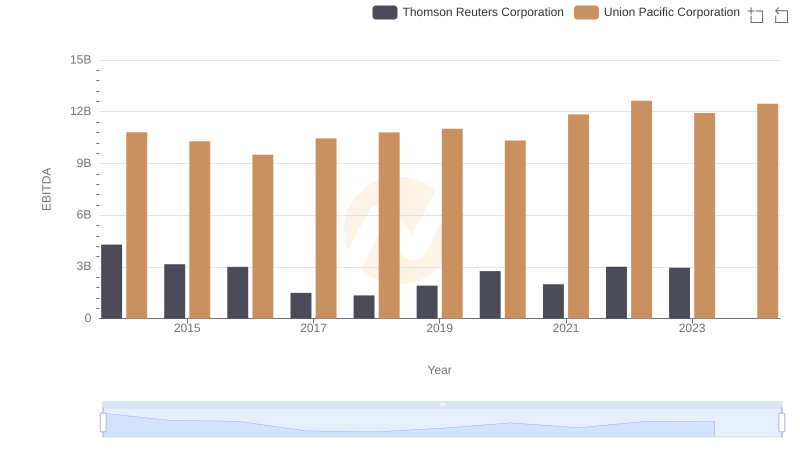
Comprehensive EBITDA Comparison: Union Pacific Corporation vs Thomson Reuters Corporation
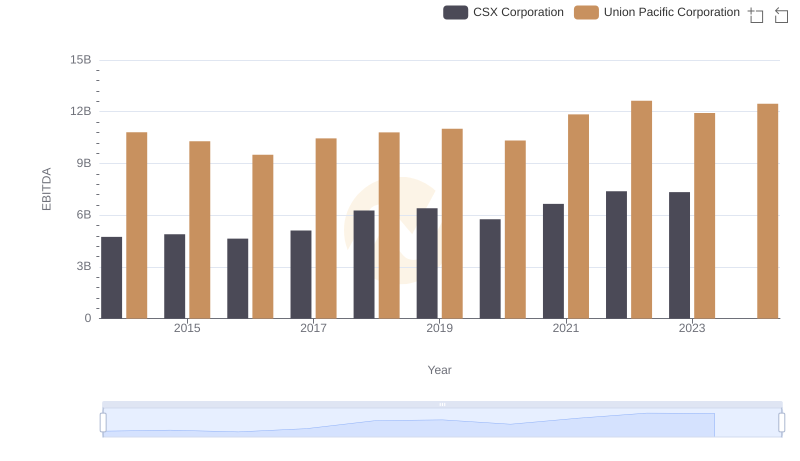
A Side-by-Side Analysis of EBITDA: Union Pacific Corporation and CSX Corporation
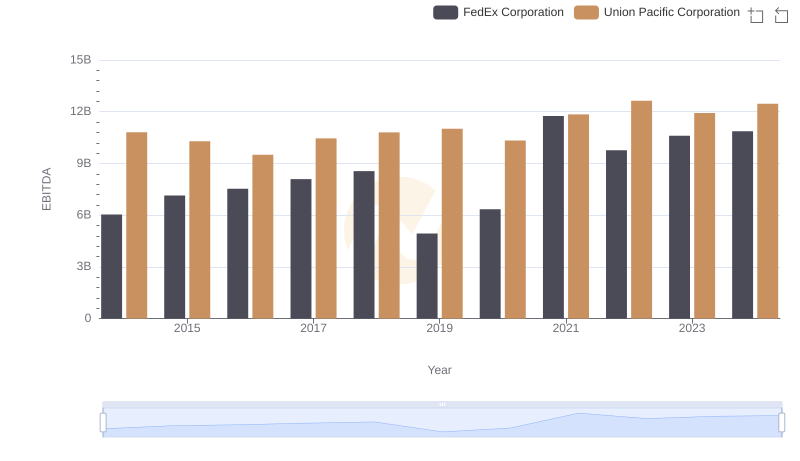
A Professional Review of EBITDA: Union Pacific Corporation Compared to FedEx Corporation
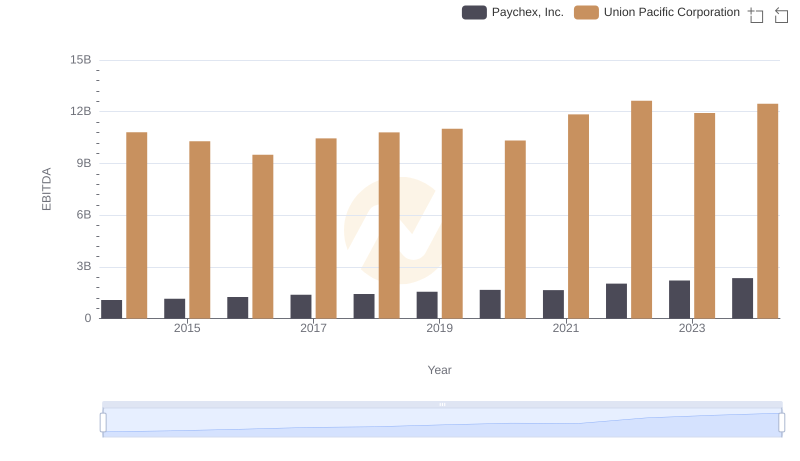
Union Pacific Corporation vs Paychex, Inc.: In-Depth EBITDA Performance Comparison