| __timestamp | Trane Technologies plc | United Rentals, Inc. |
|---|---|---|
| Wednesday, January 1, 2014 | 3908600000 | 2432000000 |
| Thursday, January 1, 2015 | 3999100000 | 2480000000 |
| Friday, January 1, 2016 | 4179600000 | 2403000000 |
| Sunday, January 1, 2017 | 4386000000 | 2769000000 |
| Monday, January 1, 2018 | 4820600000 | 3364000000 |
| Tuesday, January 1, 2019 | 5147400000 | 3670000000 |
| Wednesday, January 1, 2020 | 3803400000 | 3183000000 |
| Friday, January 1, 2021 | 4469600000 | 3853000000 |
| Saturday, January 1, 2022 | 4964800000 | 4996000000 |
| Sunday, January 1, 2023 | 5857200000 | 5813000000 |
| Monday, January 1, 2024 | 7080500000 | 6150000000 |
Unleashing insights
In the competitive landscape of industrial giants, Trane Technologies plc and United Rentals, Inc. have showcased remarkable gross profit trajectories over the past decade. From 2014 to 2023, Trane Technologies saw a robust growth of approximately 50%, peaking in 2023 with a gross profit of $5.86 billion. Meanwhile, United Rentals demonstrated an even more impressive climb, with a staggering 140% increase, reaching $5.81 billion in the same year.
The year 2020 marked a challenging period for both companies, with Trane Technologies experiencing a dip to $3.80 billion, while United Rentals managed a steadier performance at $3.18 billion. However, both companies rebounded strongly, with United Rentals surpassing Trane Technologies in 2022 and continuing its upward trend into 2024, despite missing data for Trane Technologies.
This performance breakdown highlights the dynamic shifts and resilience within the industrial sector, offering valuable insights for investors and industry analysts alike.
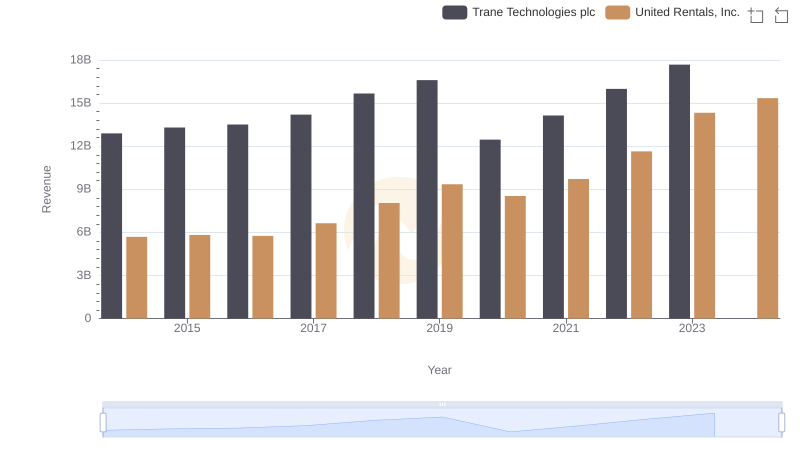
Who Generates More Revenue? Trane Technologies plc or United Rentals, Inc.
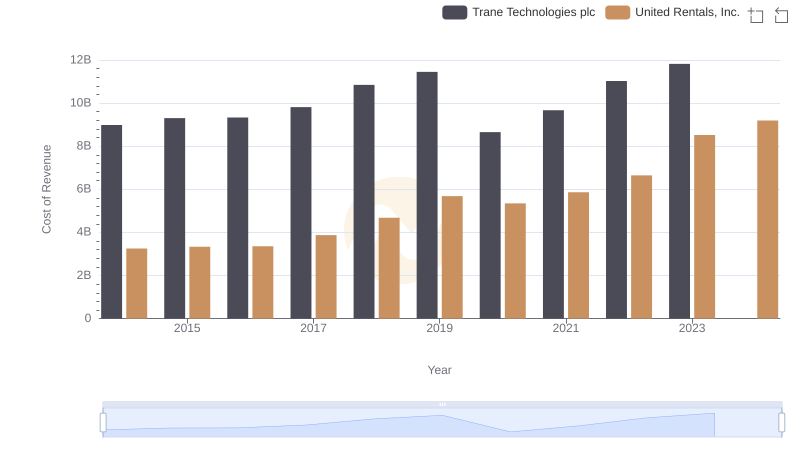
Cost of Revenue Trends: Trane Technologies plc vs United Rentals, Inc.
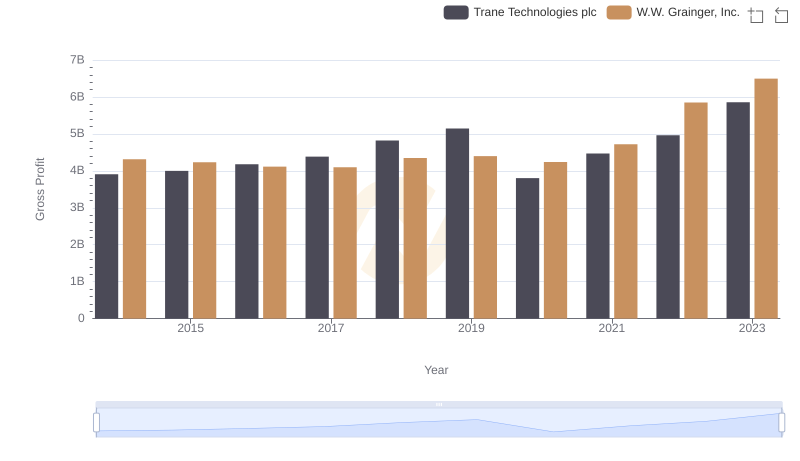
Gross Profit Comparison: Trane Technologies plc and W.W. Grainger, Inc. Trends
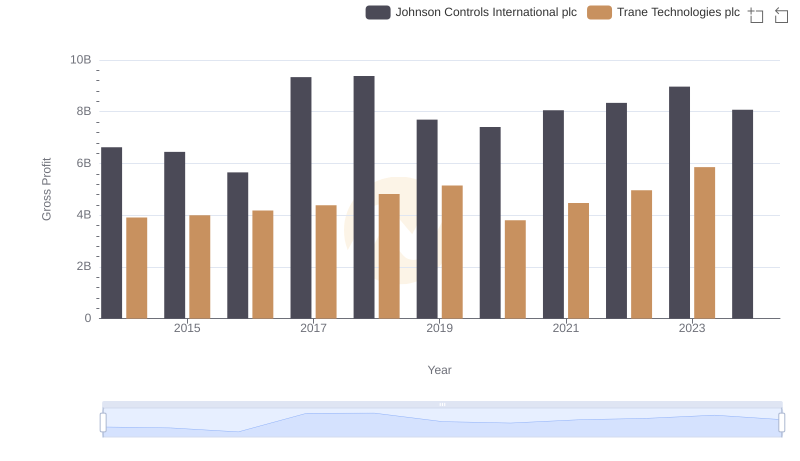
Trane Technologies plc and Johnson Controls International plc: A Detailed Gross Profit Analysis
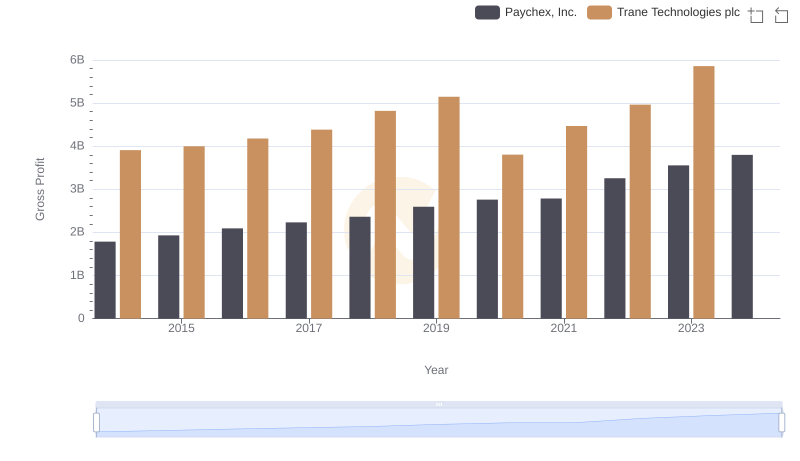
Key Insights on Gross Profit: Trane Technologies plc vs Paychex, Inc.
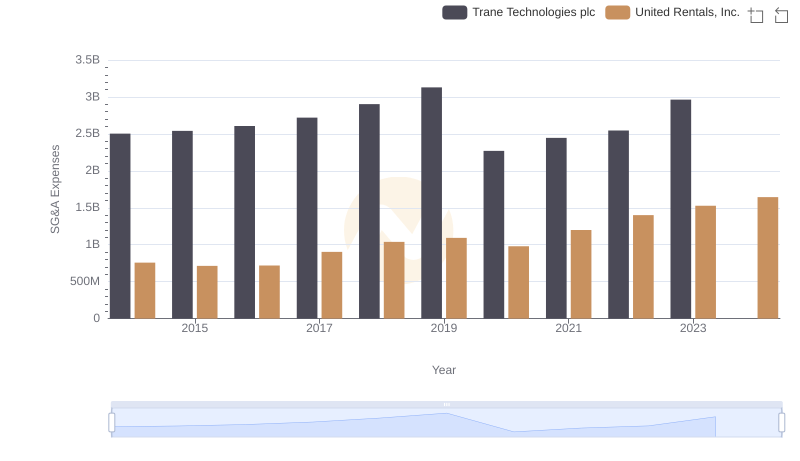
Trane Technologies plc or United Rentals, Inc.: Who Manages SG&A Costs Better?
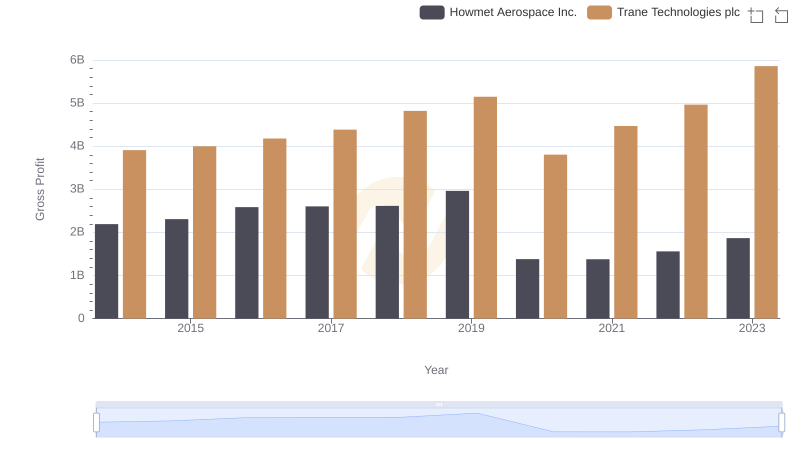
Gross Profit Comparison: Trane Technologies plc and Howmet Aerospace Inc. Trends
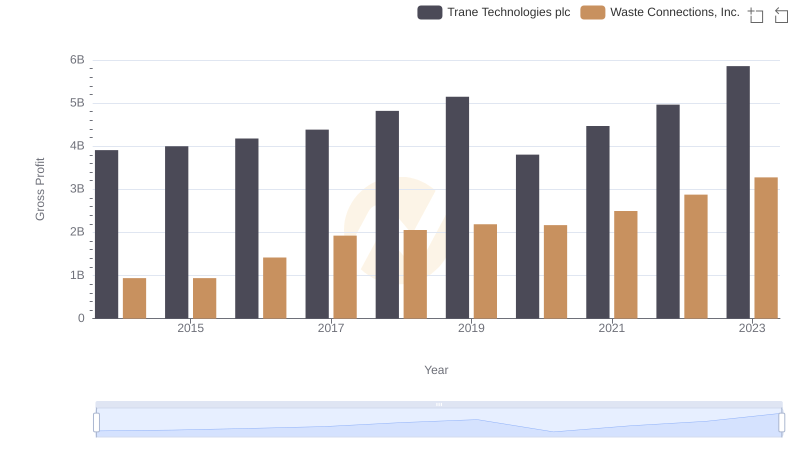
Gross Profit Comparison: Trane Technologies plc and Waste Connections, Inc. Trends
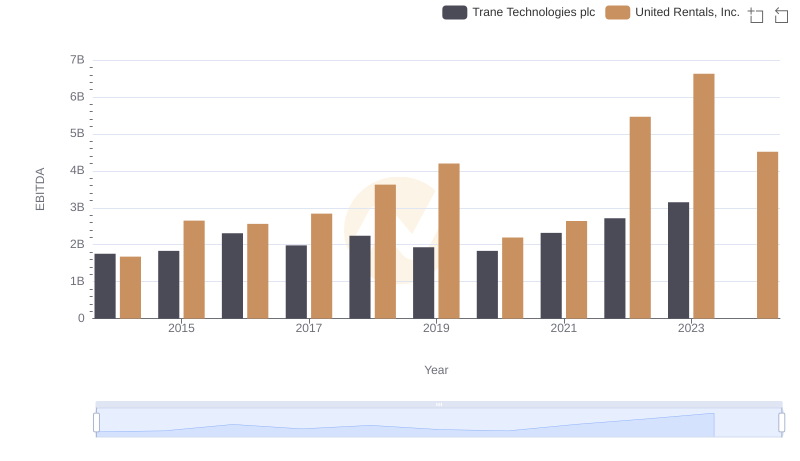
Comparative EBITDA Analysis: Trane Technologies plc vs United Rentals, Inc.