| __timestamp | Paychex, Inc. | Trane Technologies plc |
|---|---|---|
| Wednesday, January 1, 2014 | 1786400000 | 3908600000 |
| Thursday, January 1, 2015 | 1931600000 | 3999100000 |
| Friday, January 1, 2016 | 2094800000 | 4179600000 |
| Sunday, January 1, 2017 | 2231700000 | 4386000000 |
| Monday, January 1, 2018 | 2363100000 | 4820600000 |
| Tuesday, January 1, 2019 | 2594700000 | 5147400000 |
| Wednesday, January 1, 2020 | 2759700000 | 3803400000 |
| Friday, January 1, 2021 | 2785600000 | 4469600000 |
| Saturday, January 1, 2022 | 3255400000 | 4964800000 |
| Sunday, January 1, 2023 | 3554100000 | 5857200000 |
| Monday, January 1, 2024 | 3799000000 | 7080500000 |
Unveiling the hidden dimensions of data
In the competitive landscape of industrial and business services, Trane Technologies plc and Paychex, Inc. have demonstrated remarkable growth in gross profit over the past decade. From 2014 to 2023, Trane Technologies saw its gross profit soar by approximately 50%, peaking at $5.86 billion in 2023. Meanwhile, Paychex, Inc. experienced a robust 100% increase, reaching $3.55 billion in the same year.
The data for 2024 is incomplete, indicating potential for further analysis as new figures emerge. This comparison underscores the dynamic nature of these industries and the strategic maneuvers companies must employ to maintain growth.
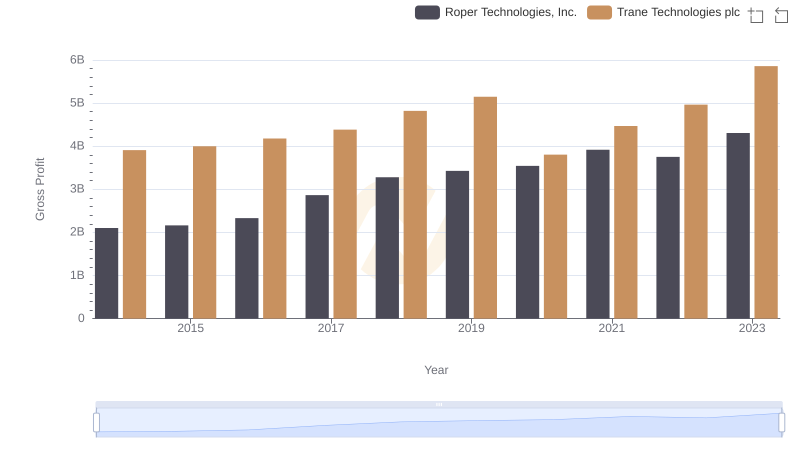
Trane Technologies plc vs Roper Technologies, Inc.: A Gross Profit Performance Breakdown
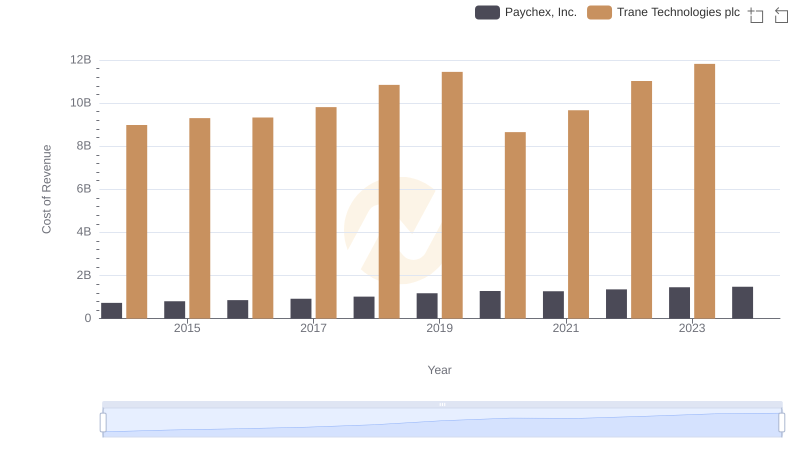
Cost Insights: Breaking Down Trane Technologies plc and Paychex, Inc.'s Expenses
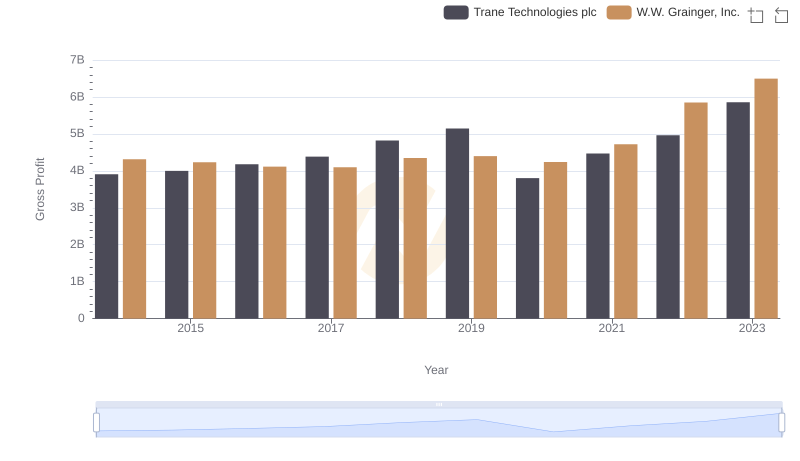
Gross Profit Comparison: Trane Technologies plc and W.W. Grainger, Inc. Trends
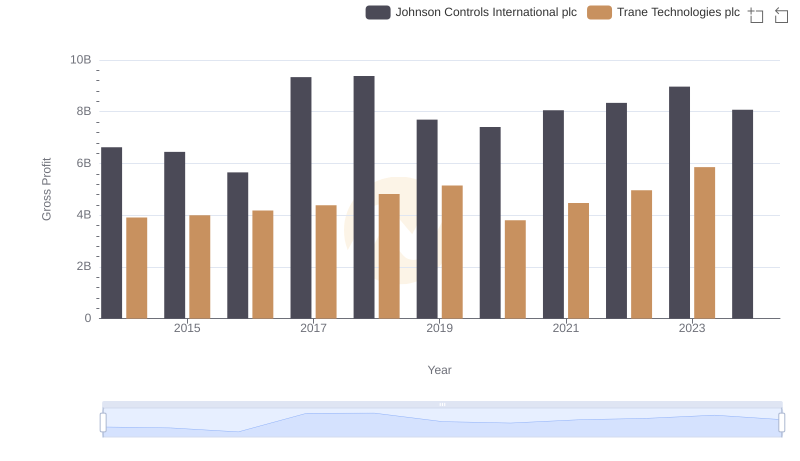
Trane Technologies plc and Johnson Controls International plc: A Detailed Gross Profit Analysis
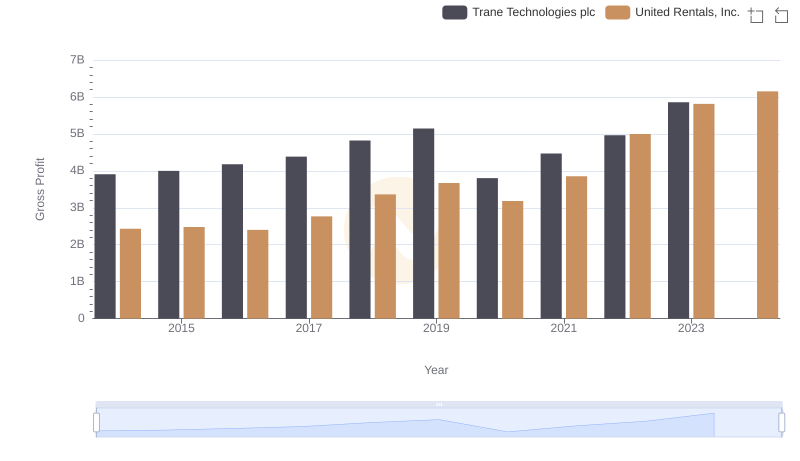
Trane Technologies plc vs United Rentals, Inc.: A Gross Profit Performance Breakdown
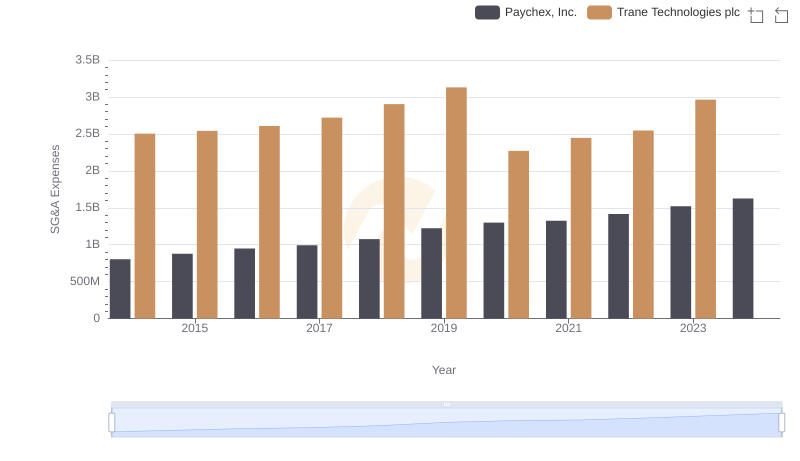
Who Optimizes SG&A Costs Better? Trane Technologies plc or Paychex, Inc.
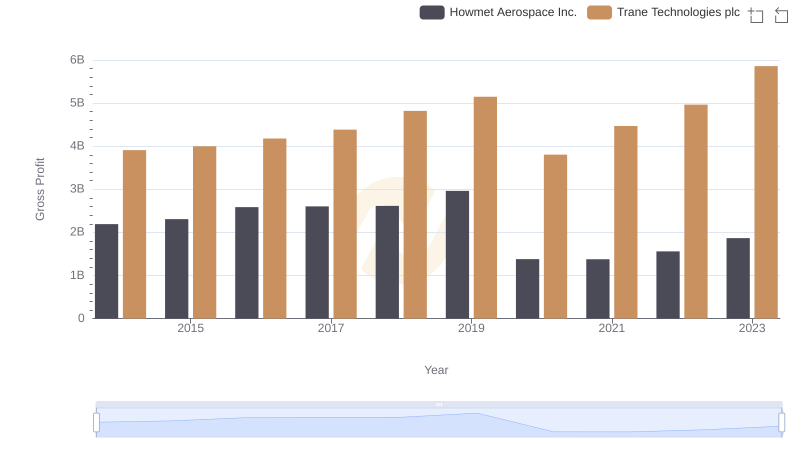
Gross Profit Comparison: Trane Technologies plc and Howmet Aerospace Inc. Trends