| __timestamp | Howmet Aerospace Inc. | Trane Technologies plc |
|---|---|---|
| Wednesday, January 1, 2014 | 2193000000 | 3908600000 |
| Thursday, January 1, 2015 | 2309000000 | 3999100000 |
| Friday, January 1, 2016 | 2588000000 | 4179600000 |
| Sunday, January 1, 2017 | 2603000000 | 4386000000 |
| Monday, January 1, 2018 | 2617000000 | 4820600000 |
| Tuesday, January 1, 2019 | 2965000000 | 5147400000 |
| Wednesday, January 1, 2020 | 1381000000 | 3803400000 |
| Friday, January 1, 2021 | 1376000000 | 4469600000 |
| Saturday, January 1, 2022 | 1560000000 | 4964800000 |
| Sunday, January 1, 2023 | 1867000000 | 5857200000 |
| Monday, January 1, 2024 | 2311000000 | 7080500000 |
Data in motion
In the ever-evolving landscape of industrial innovation, Trane Technologies plc and Howmet Aerospace Inc. have emerged as key players. Over the past decade, these companies have demonstrated resilience and growth, albeit with distinct trajectories. From 2014 to 2023, Trane Technologies has consistently outperformed Howmet Aerospace in terms of gross profit, with an average annual increase of approximately 4%. By 2023, Trane Technologies' gross profit surged to nearly 50% higher than its 2014 figures, reaching a peak of $5.86 billion.
Conversely, Howmet Aerospace experienced a more volatile journey. Despite a promising start, with gross profits peaking in 2019, the company faced a significant downturn in 2020, dropping by over 50% from its peak. However, a recovery trend is evident, with a 35% increase from 2020 to 2023. This comparison highlights the dynamic nature of the industrial sector and the strategic maneuvers companies must employ to thrive.
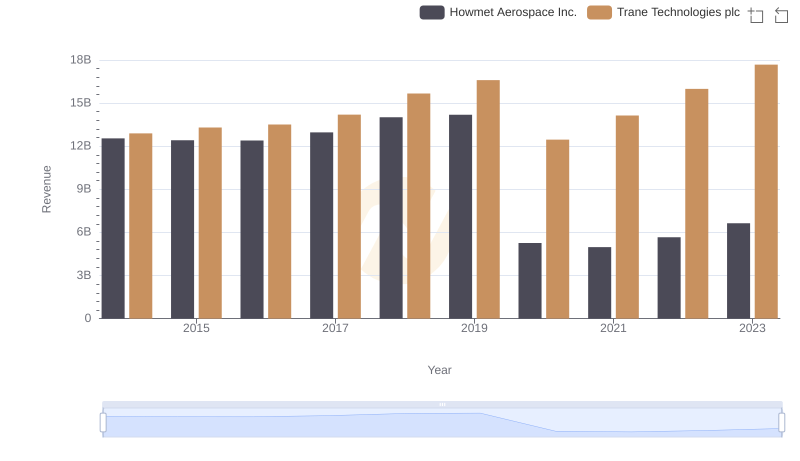
Breaking Down Revenue Trends: Trane Technologies plc vs Howmet Aerospace Inc.
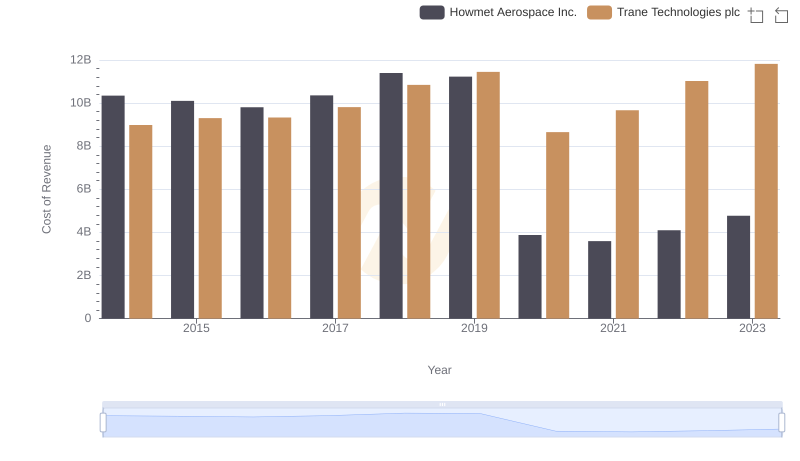
Cost of Revenue Trends: Trane Technologies plc vs Howmet Aerospace Inc.
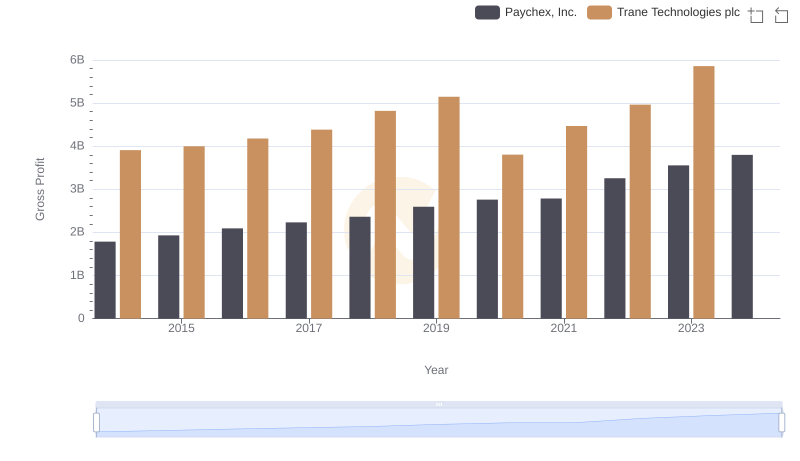
Key Insights on Gross Profit: Trane Technologies plc vs Paychex, Inc.
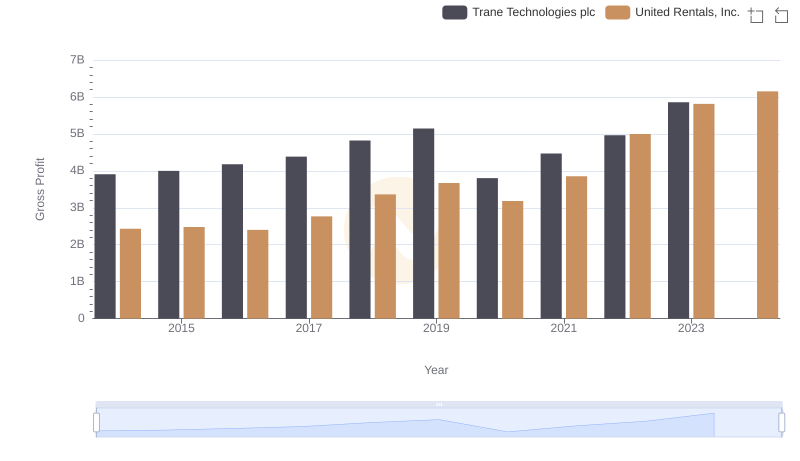
Trane Technologies plc vs United Rentals, Inc.: A Gross Profit Performance Breakdown
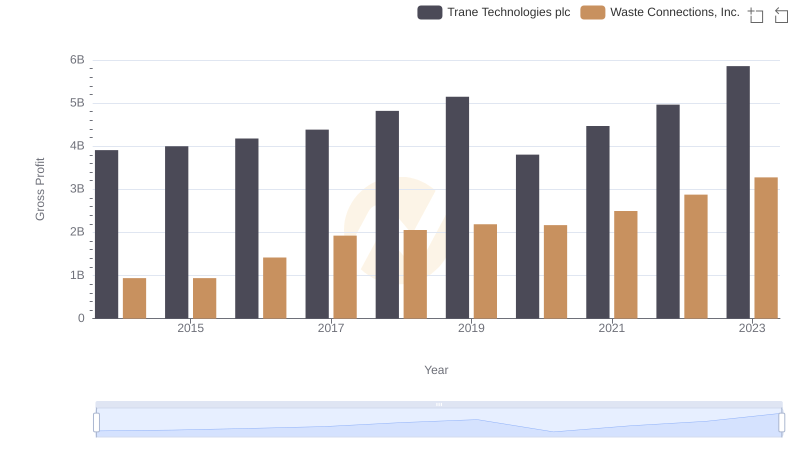
Gross Profit Comparison: Trane Technologies plc and Waste Connections, Inc. Trends
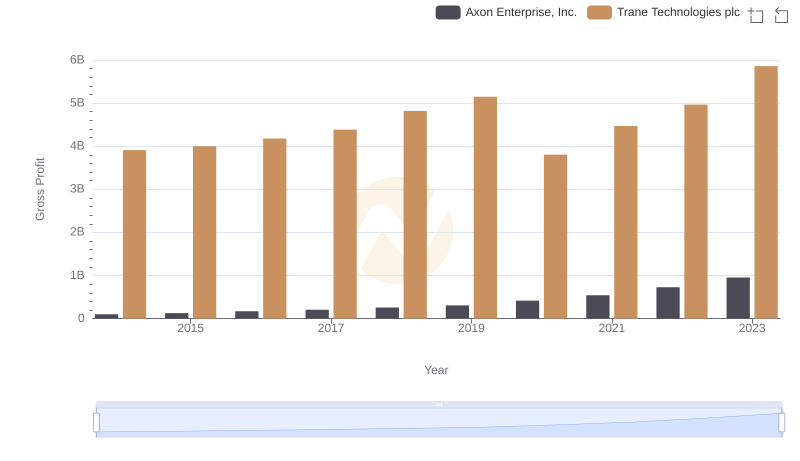
Trane Technologies plc vs Axon Enterprise, Inc.: A Gross Profit Performance Breakdown
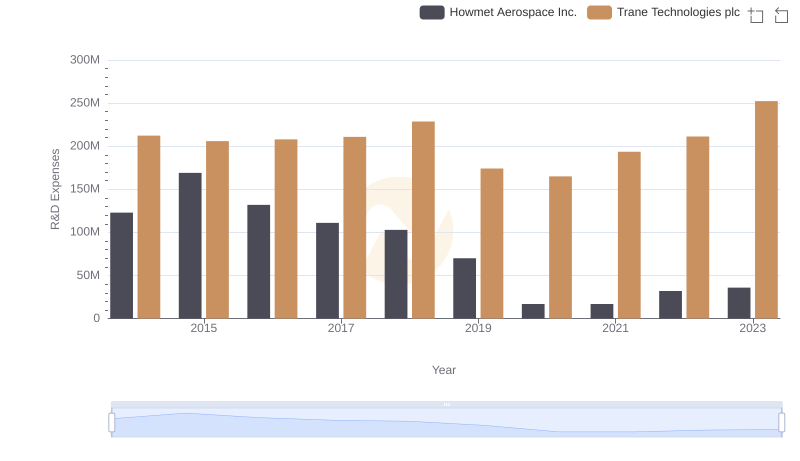
Analyzing R&D Budgets: Trane Technologies plc vs Howmet Aerospace Inc.