| __timestamp | Trane Technologies plc | United Rentals, Inc. |
|---|---|---|
| Wednesday, January 1, 2014 | 1757000000 | 1678000000 |
| Thursday, January 1, 2015 | 1835000000 | 2653000000 |
| Friday, January 1, 2016 | 2311000000 | 2566000000 |
| Sunday, January 1, 2017 | 1982500000 | 2843000000 |
| Monday, January 1, 2018 | 2242400000 | 3628000000 |
| Tuesday, January 1, 2019 | 1931200000 | 4200000000 |
| Wednesday, January 1, 2020 | 1831900000 | 2195000000 |
| Friday, January 1, 2021 | 2319200000 | 2642000000 |
| Saturday, January 1, 2022 | 2715500000 | 5464000000 |
| Sunday, January 1, 2023 | 3149900000 | 6627000000 |
| Monday, January 1, 2024 | 3859600000 | 4516000000 |
Infusing magic into the data realm
In the competitive landscape of industrial giants, Trane Technologies plc and United Rentals, Inc. have showcased remarkable EBITDA growth over the past decade. From 2014 to 2023, United Rentals has consistently outperformed, with a staggering 295% increase in EBITDA, peaking at $6.6 billion in 2023. Trane Technologies, while trailing, has demonstrated a robust 79% growth, reaching $3.1 billion in the same year.
United Rentals' strategic expansions and acquisitions have fueled its impressive growth trajectory, particularly evident in the 2018-2023 period, where EBITDA surged by 83%. Meanwhile, Trane Technologies has focused on sustainable innovations, contributing to its steady rise.
The data for 2024 is incomplete, highlighting the dynamic nature of these industries. As both companies continue to evolve, stakeholders and investors should watch closely for future developments in this ever-changing market.
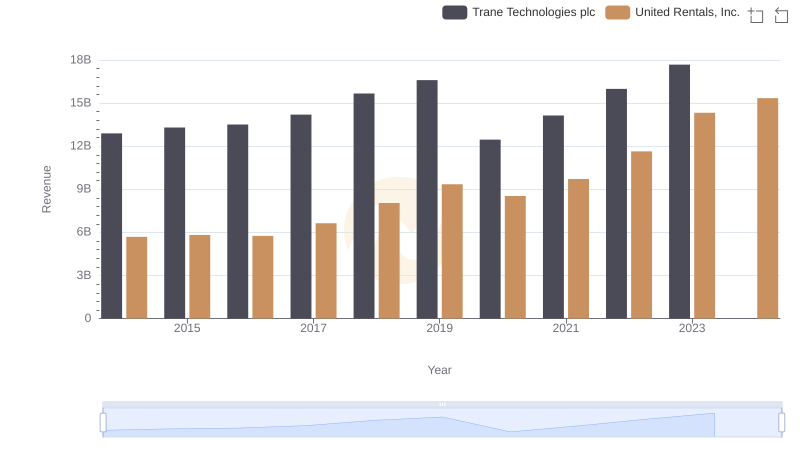
Who Generates More Revenue? Trane Technologies plc or United Rentals, Inc.
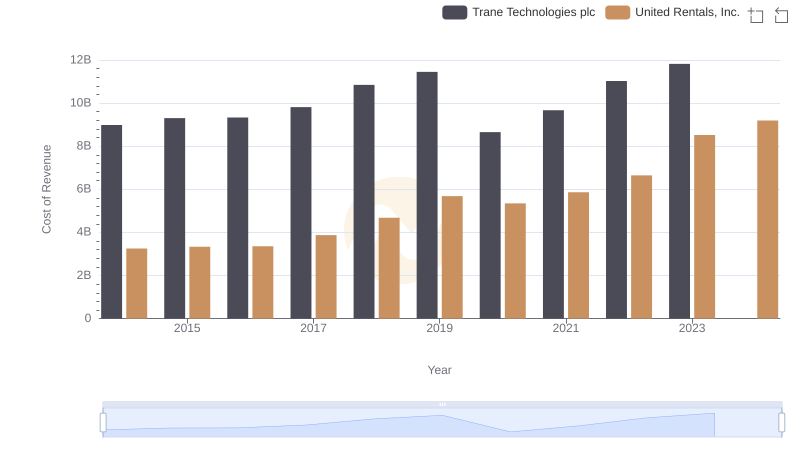
Cost of Revenue Trends: Trane Technologies plc vs United Rentals, Inc.
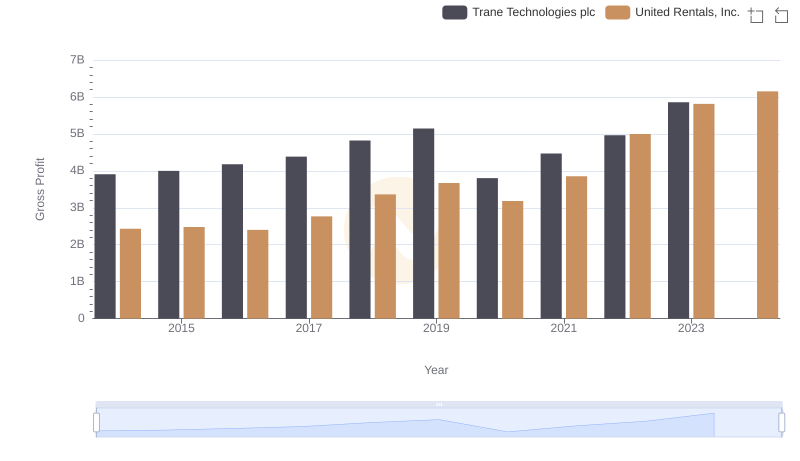
Trane Technologies plc vs United Rentals, Inc.: A Gross Profit Performance Breakdown
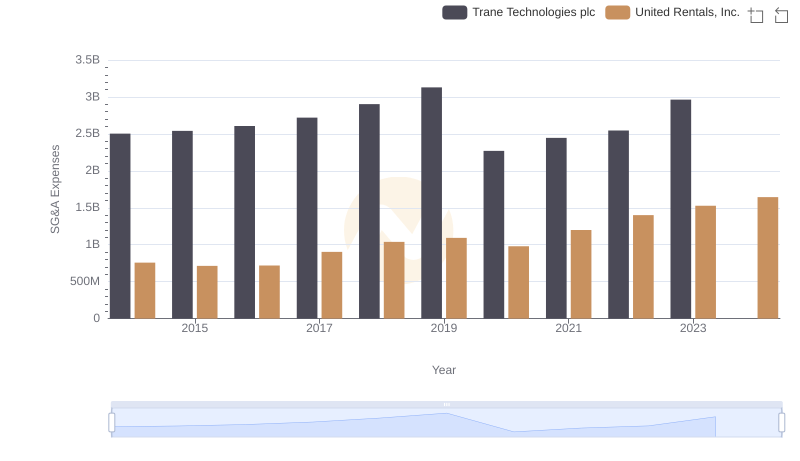
Trane Technologies plc or United Rentals, Inc.: Who Manages SG&A Costs Better?
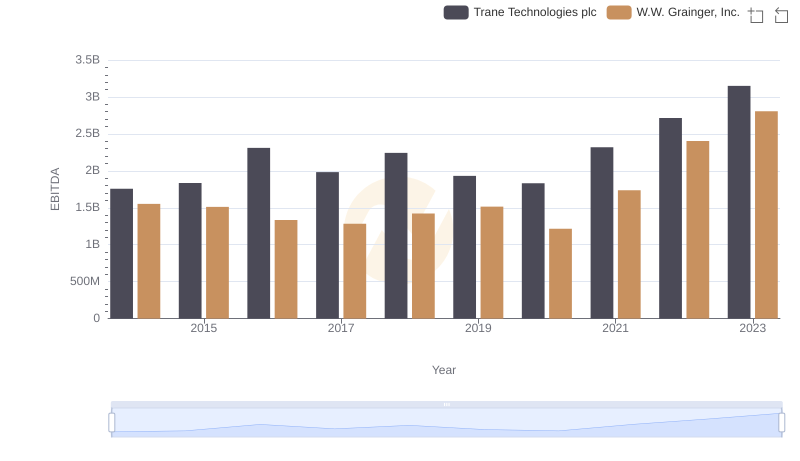
EBITDA Metrics Evaluated: Trane Technologies plc vs W.W. Grainger, Inc.
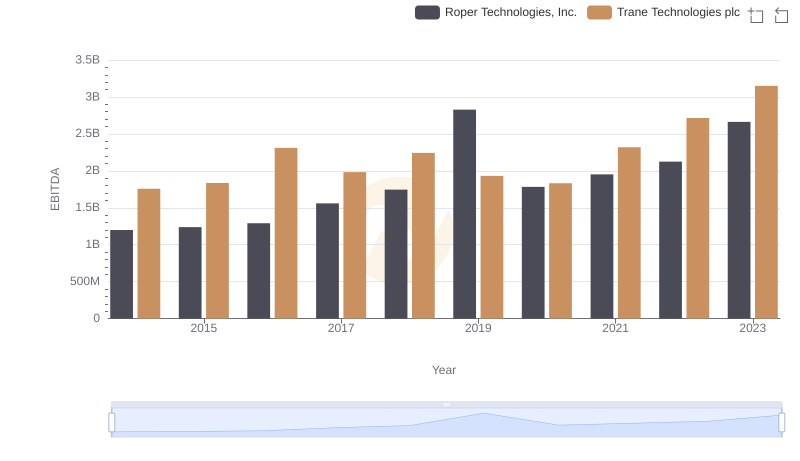
A Side-by-Side Analysis of EBITDA: Trane Technologies plc and Roper Technologies, Inc.
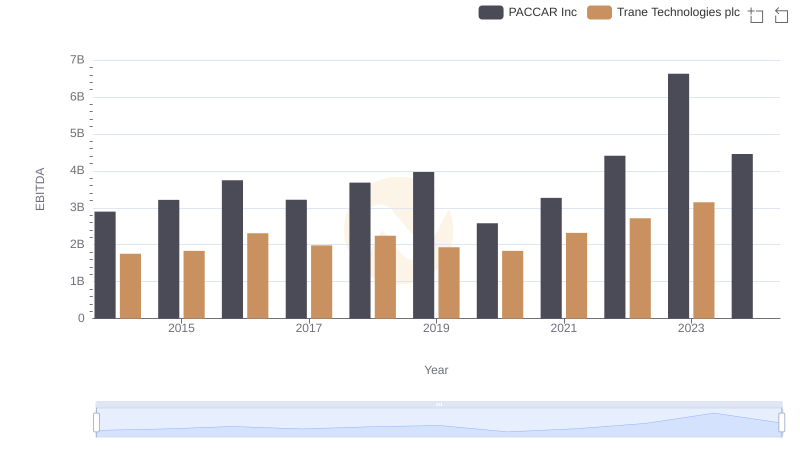
Trane Technologies plc vs PACCAR Inc: In-Depth EBITDA Performance Comparison
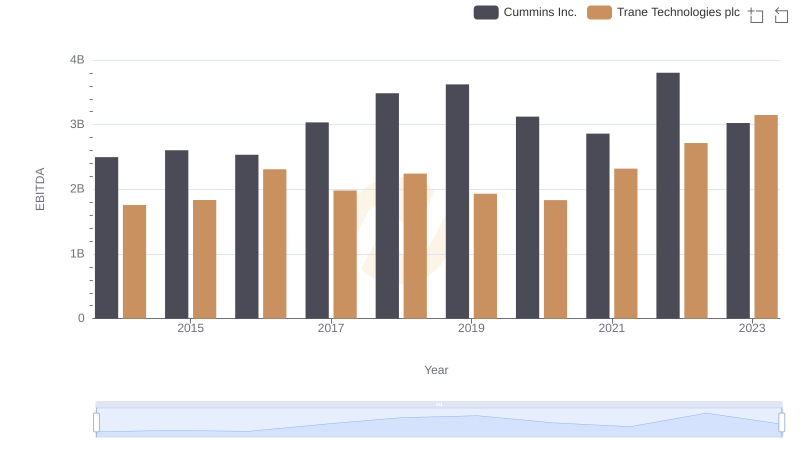
A Side-by-Side Analysis of EBITDA: Trane Technologies plc and Cummins Inc.
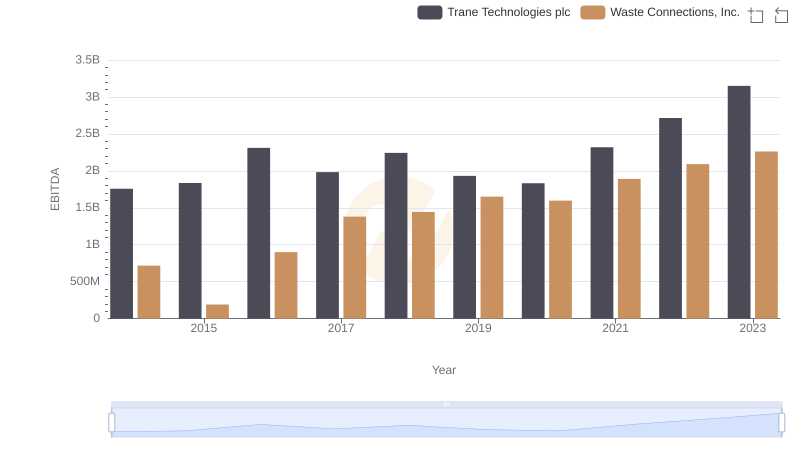
Trane Technologies plc and Waste Connections, Inc.: A Detailed Examination of EBITDA Performance