| __timestamp | Johnson Controls International plc | Trane Technologies plc |
|---|---|---|
| Wednesday, January 1, 2014 | 6627000000 | 3908600000 |
| Thursday, January 1, 2015 | 6447000000 | 3999100000 |
| Friday, January 1, 2016 | 5654000000 | 4179600000 |
| Sunday, January 1, 2017 | 9339000000 | 4386000000 |
| Monday, January 1, 2018 | 9380000000 | 4820600000 |
| Tuesday, January 1, 2019 | 7693000000 | 5147400000 |
| Wednesday, January 1, 2020 | 7411000000 | 3803400000 |
| Friday, January 1, 2021 | 8059000000 | 4469600000 |
| Saturday, January 1, 2022 | 8343000000 | 4964800000 |
| Sunday, January 1, 2023 | 8971000000 | 5857200000 |
| Monday, January 1, 2024 | 8077000000 | 7080500000 |
Unveiling the hidden dimensions of data
In the ever-evolving landscape of industrial innovation, Trane Technologies and Johnson Controls have been pivotal players. Over the past decade, these companies have showcased remarkable resilience and growth in their gross profit margins. From 2014 to 2023, Johnson Controls experienced a robust 35% increase in gross profit, peaking in 2018 and 2019. Meanwhile, Trane Technologies demonstrated a steady upward trajectory, culminating in a 50% rise by 2023.
This analysis highlights the dynamic nature of the industrial sector and the strategic maneuvers these companies have employed to maintain their competitive edge.
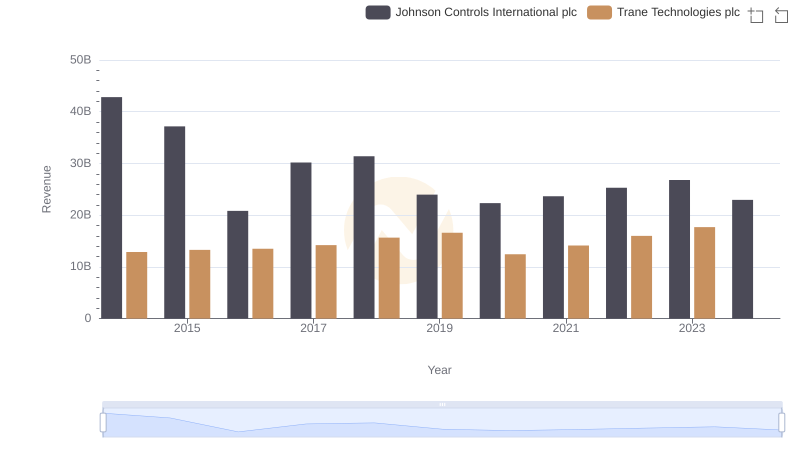
Revenue Insights: Trane Technologies plc and Johnson Controls International plc Performance Compared
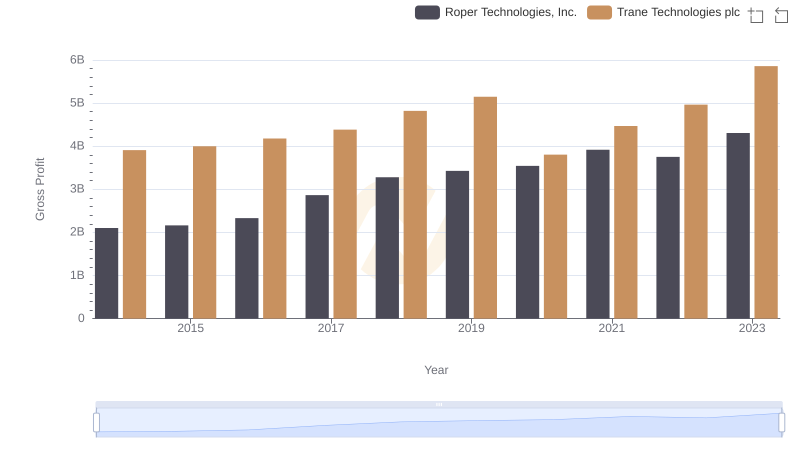
Trane Technologies plc vs Roper Technologies, Inc.: A Gross Profit Performance Breakdown
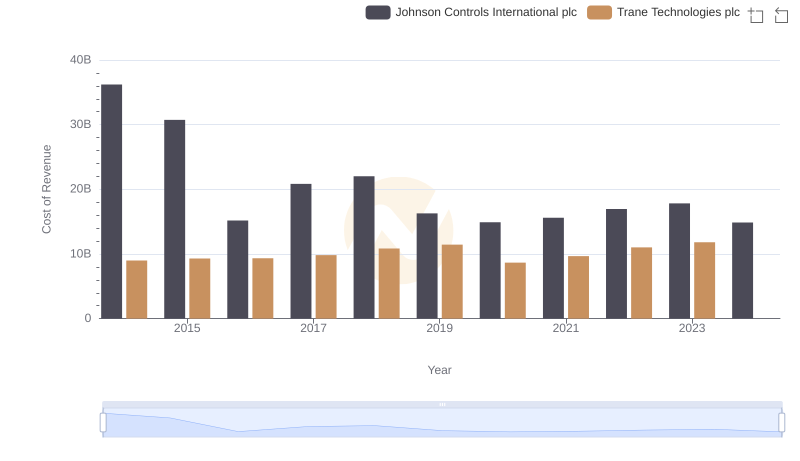
Cost of Revenue Comparison: Trane Technologies plc vs Johnson Controls International plc
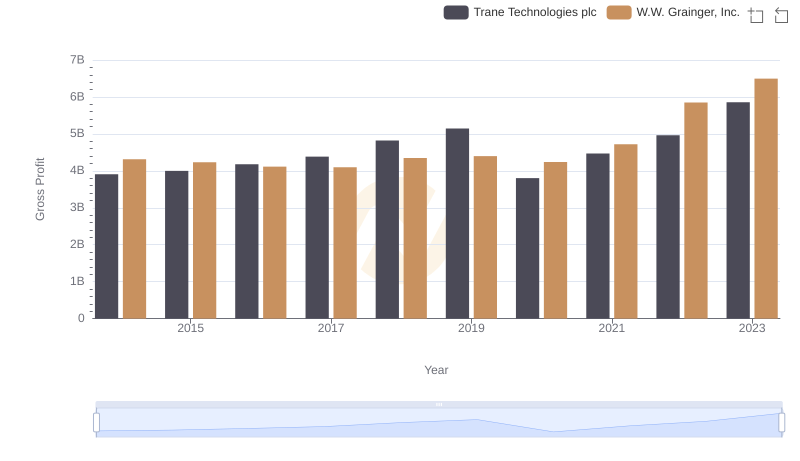
Gross Profit Comparison: Trane Technologies plc and W.W. Grainger, Inc. Trends
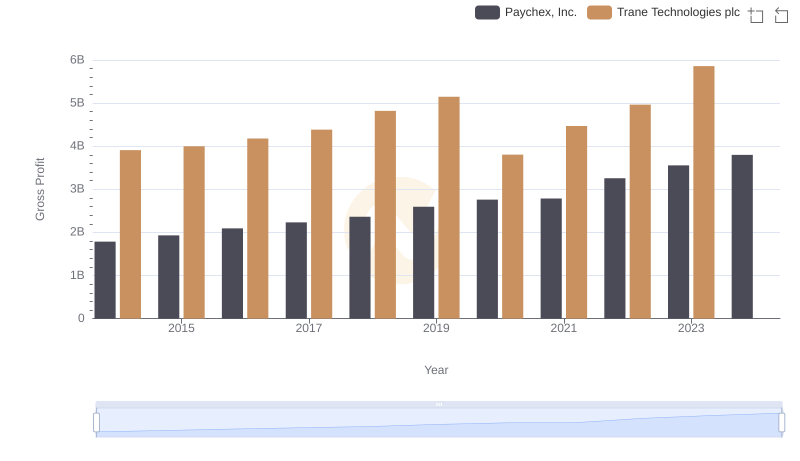
Key Insights on Gross Profit: Trane Technologies plc vs Paychex, Inc.
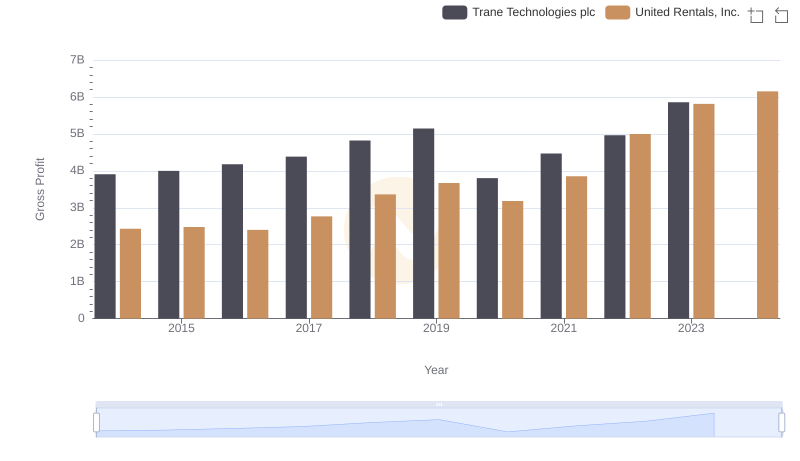
Trane Technologies plc vs United Rentals, Inc.: A Gross Profit Performance Breakdown
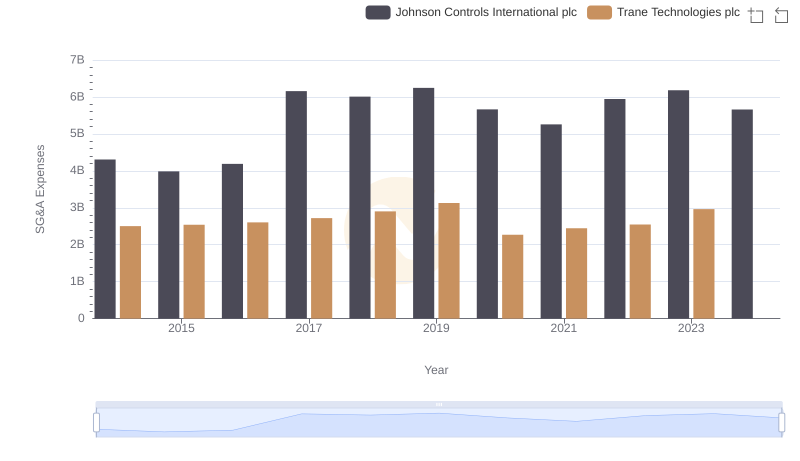
Breaking Down SG&A Expenses: Trane Technologies plc vs Johnson Controls International plc
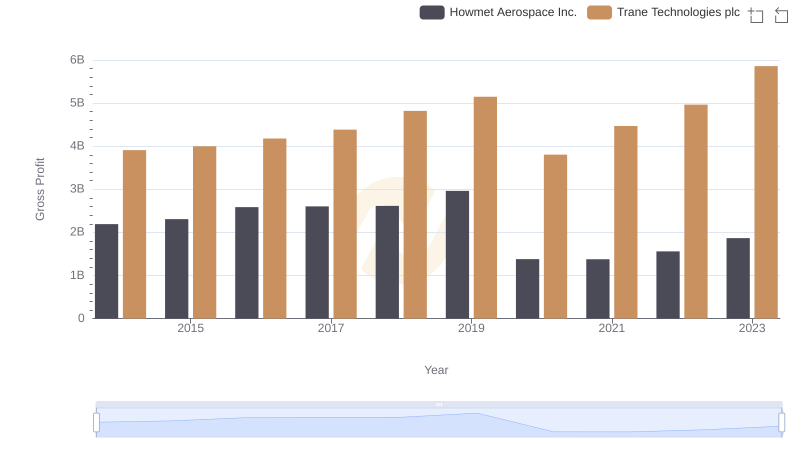
Gross Profit Comparison: Trane Technologies plc and Howmet Aerospace Inc. Trends