| __timestamp | Rockwell Automation, Inc. | Trane Technologies plc |
|---|---|---|
| Wednesday, January 1, 2014 | 1570100000 | 2503900000 |
| Thursday, January 1, 2015 | 1506400000 | 2541100000 |
| Friday, January 1, 2016 | 1467400000 | 2606500000 |
| Sunday, January 1, 2017 | 1591500000 | 2720700000 |
| Monday, January 1, 2018 | 1599000000 | 2903200000 |
| Tuesday, January 1, 2019 | 1538500000 | 3129800000 |
| Wednesday, January 1, 2020 | 1479800000 | 2270600000 |
| Friday, January 1, 2021 | 1680000000 | 2446300000 |
| Saturday, January 1, 2022 | 1766700000 | 2545900000 |
| Sunday, January 1, 2023 | 2023700000 | 2963200000 |
| Monday, January 1, 2024 | 2002600000 | 3580400000 |
Cracking the code
In the competitive landscape of industrial technology, understanding the efficiency of Selling, General, and Administrative (SG&A) expenses is crucial. Trane Technologies plc and Rockwell Automation, Inc. have been pivotal players in this domain. Over the past decade, from 2014 to 2023, Trane Technologies has consistently outpaced Rockwell Automation in SG&A spending, with an average of 2.66 billion compared to Rockwell's 1.66 billion. This indicates Trane's aggressive investment in administrative efficiency and market expansion. Notably, in 2023, Rockwell Automation saw a significant increase in SG&A expenses, reaching 2.02 billion, marking a 15% rise from the previous year. Meanwhile, Trane Technologies peaked in 2019 with 3.13 billion, showcasing a strategic shift in their operational focus. The data for 2024 is incomplete, highlighting the dynamic nature of financial strategies in these corporations. This analysis underscores the importance of SG&A efficiency in driving corporate success.
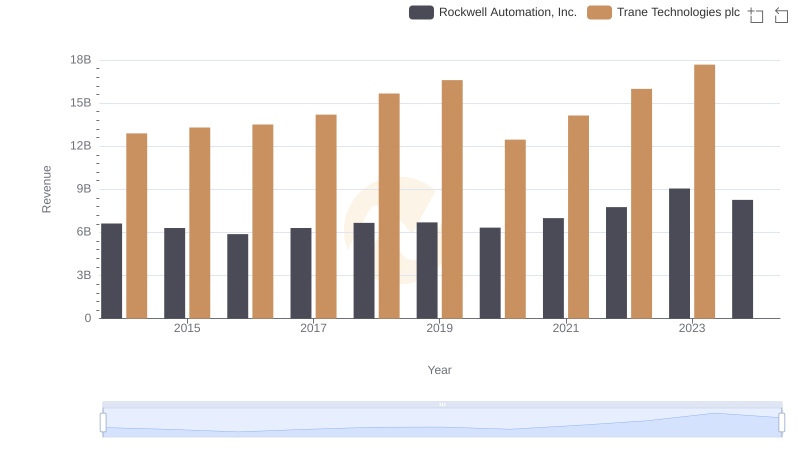
Trane Technologies plc or Rockwell Automation, Inc.: Who Leads in Yearly Revenue?
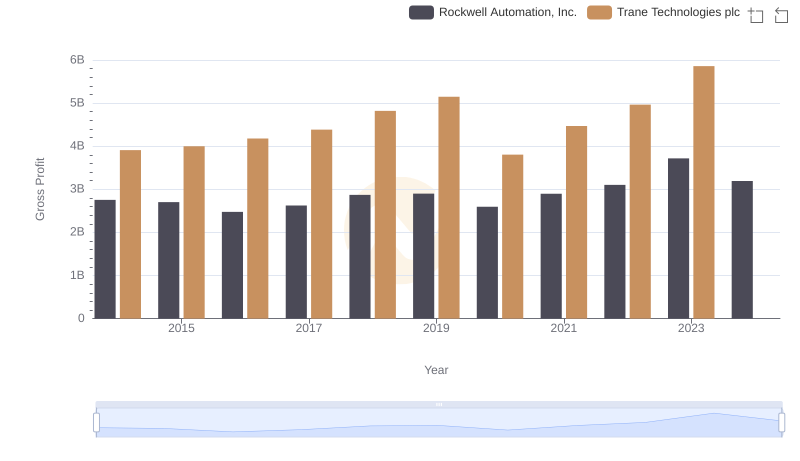
Who Generates Higher Gross Profit? Trane Technologies plc or Rockwell Automation, Inc.
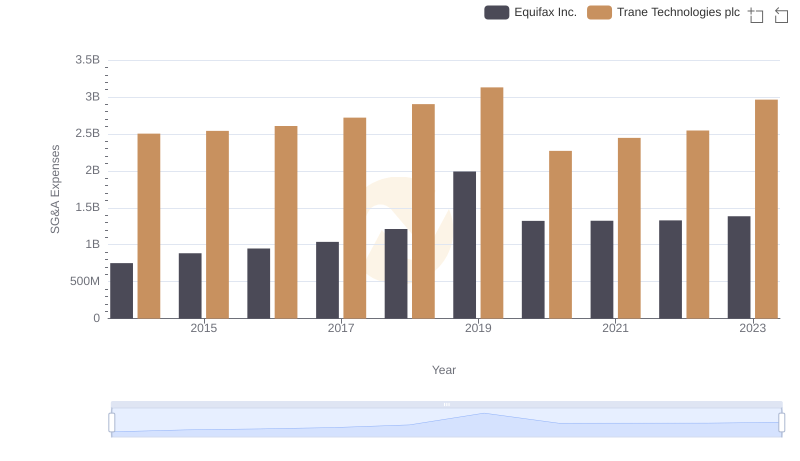
Breaking Down SG&A Expenses: Trane Technologies plc vs Equifax Inc.
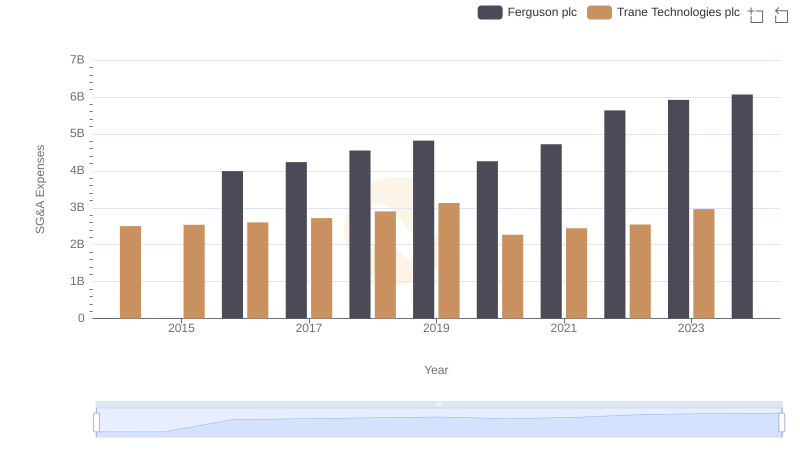
Trane Technologies plc vs Ferguson plc: SG&A Expense Trends
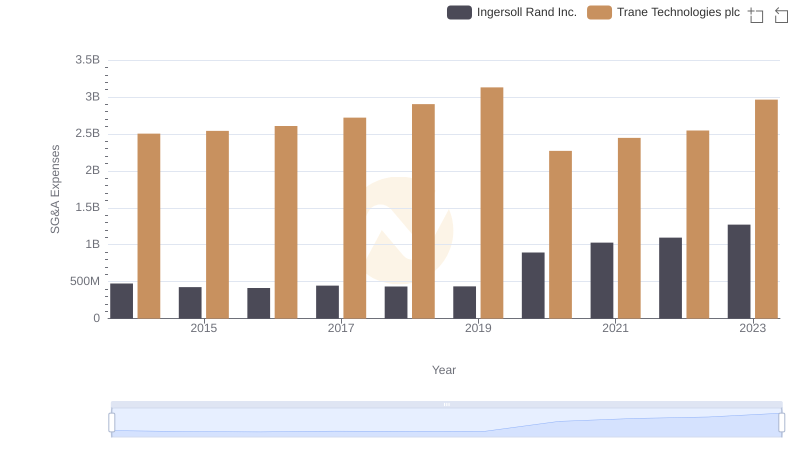
Comparing SG&A Expenses: Trane Technologies plc vs Ingersoll Rand Inc. Trends and Insights
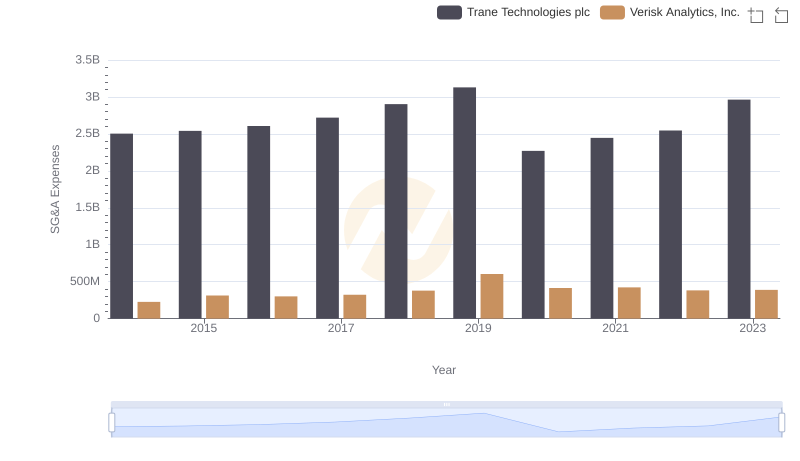
Cost Management Insights: SG&A Expenses for Trane Technologies plc and Verisk Analytics, Inc.
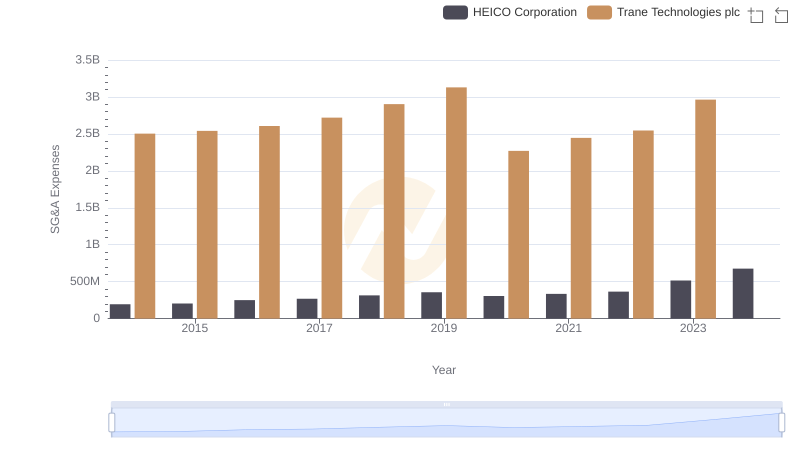
Trane Technologies plc or HEICO Corporation: Who Manages SG&A Costs Better?
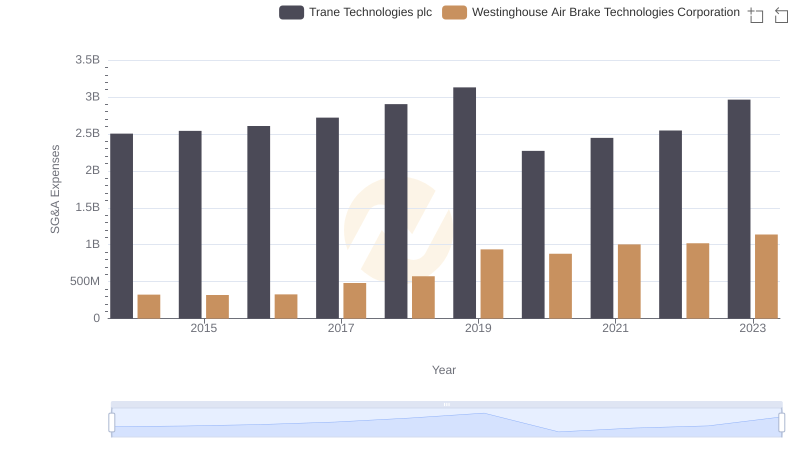
Trane Technologies plc and Westinghouse Air Brake Technologies Corporation: SG&A Spending Patterns Compared