| __timestamp | Axon Enterprise, Inc. | Trane Technologies plc |
|---|---|---|
| Wednesday, January 1, 2014 | 54158000 | 2503900000 |
| Thursday, January 1, 2015 | 69698000 | 2541100000 |
| Friday, January 1, 2016 | 108076000 | 2606500000 |
| Sunday, January 1, 2017 | 138692000 | 2720700000 |
| Monday, January 1, 2018 | 156886000 | 2903200000 |
| Tuesday, January 1, 2019 | 212959000 | 3129800000 |
| Wednesday, January 1, 2020 | 307286000 | 2270600000 |
| Friday, January 1, 2021 | 515007000 | 2446300000 |
| Saturday, January 1, 2022 | 401575000 | 2545900000 |
| Sunday, January 1, 2023 | 496874000 | 2963200000 |
| Monday, January 1, 2024 | 3580400000 |
Data in motion
In the ever-evolving landscape of corporate finance, understanding operational costs is crucial. Over the past decade, Trane Technologies plc and Axon Enterprise, Inc. have showcased distinct trajectories in their Selling, General, and Administrative (SG&A) expenses. Trane Technologies, a leader in climate innovation, consistently reported higher SG&A expenses, peaking at nearly $3 billion in 2019. This reflects their expansive global operations and commitment to innovation. In contrast, Axon Enterprise, known for its public safety technologies, saw a significant rise in SG&A, with a remarkable 800% increase from 2014 to 2023. This surge underscores Axon's aggressive growth strategy and market expansion. As we delve into these figures, it's evident that while Trane's expenses are stabilizing, Axon's upward trend highlights its dynamic market positioning. This analysis offers a window into how these industry giants allocate resources to maintain competitive edges.
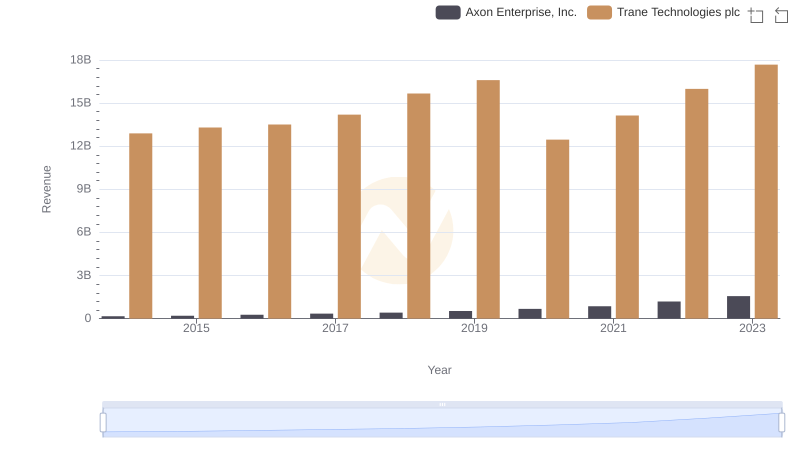
Revenue Showdown: Trane Technologies plc vs Axon Enterprise, Inc.
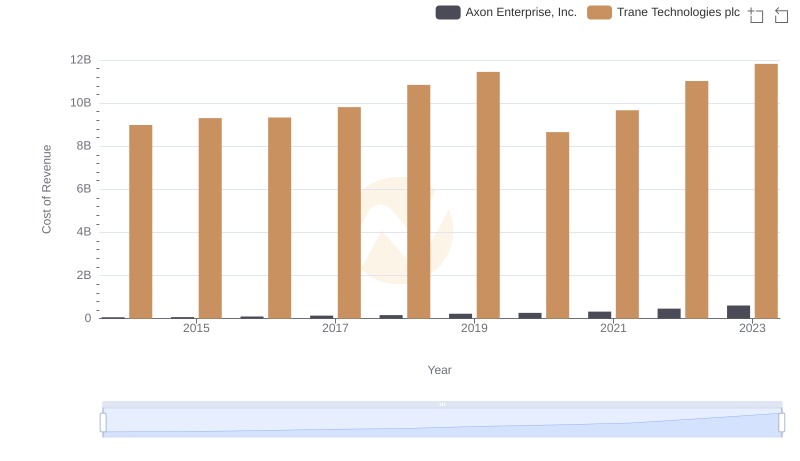
Cost of Revenue: Key Insights for Trane Technologies plc and Axon Enterprise, Inc.
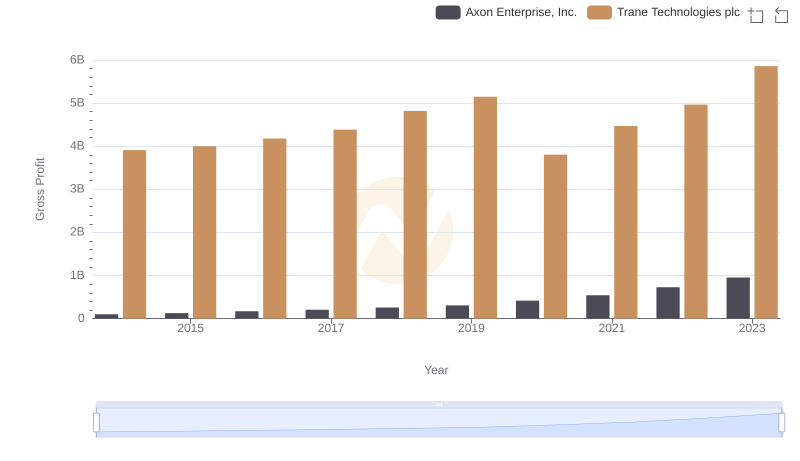
Trane Technologies plc vs Axon Enterprise, Inc.: A Gross Profit Performance Breakdown
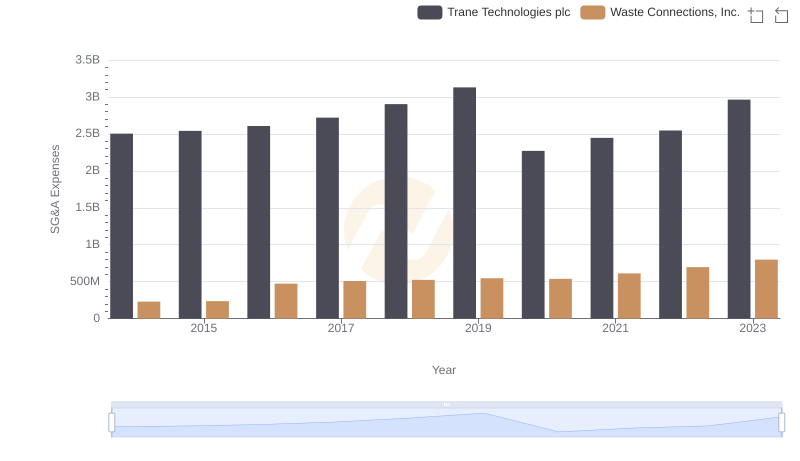
Cost Management Insights: SG&A Expenses for Trane Technologies plc and Waste Connections, Inc.
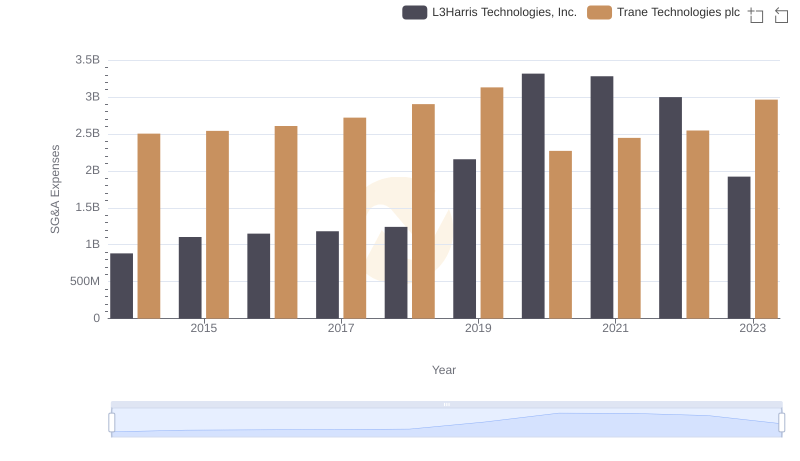
SG&A Efficiency Analysis: Comparing Trane Technologies plc and L3Harris Technologies, Inc.
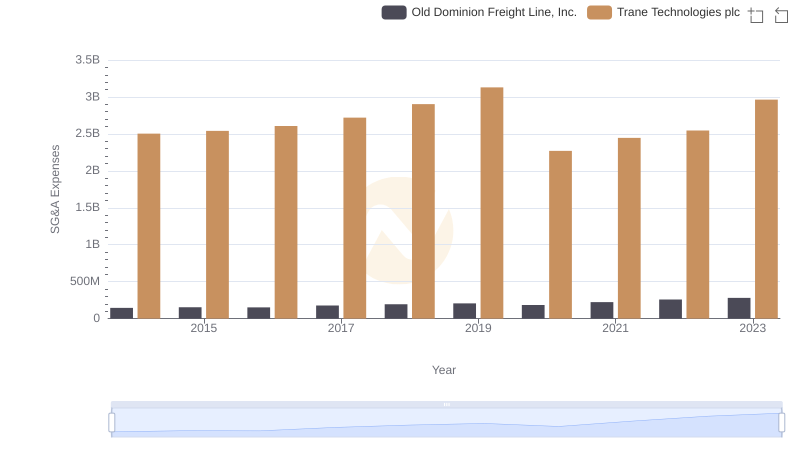
Trane Technologies plc or Old Dominion Freight Line, Inc.: Who Manages SG&A Costs Better?
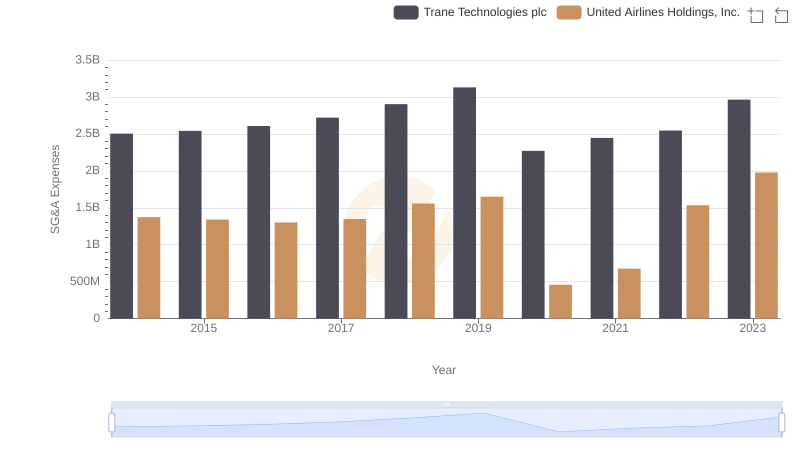
Trane Technologies plc vs United Airlines Holdings, Inc.: SG&A Expense Trends
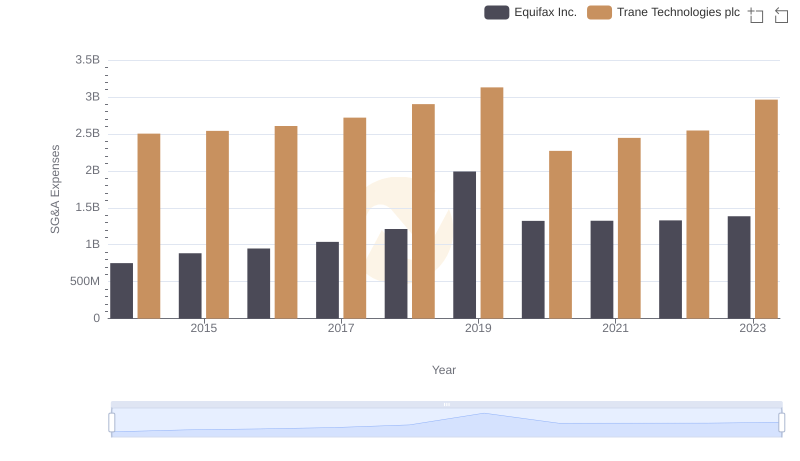
Breaking Down SG&A Expenses: Trane Technologies plc vs Equifax Inc.