| __timestamp | Northrop Grumman Corporation | Trane Technologies plc |
|---|---|---|
| Wednesday, January 1, 2014 | 23979000000 | 12891400000 |
| Thursday, January 1, 2015 | 23526000000 | 13300700000 |
| Friday, January 1, 2016 | 24508000000 | 13508900000 |
| Sunday, January 1, 2017 | 25803000000 | 14197600000 |
| Monday, January 1, 2018 | 30095000000 | 15668200000 |
| Tuesday, January 1, 2019 | 33841000000 | 16598900000 |
| Wednesday, January 1, 2020 | 36799000000 | 12454700000 |
| Friday, January 1, 2021 | 35667000000 | 14136400000 |
| Saturday, January 1, 2022 | 36602000000 | 15991700000 |
| Sunday, January 1, 2023 | 39290000000 | 17677600000 |
| Monday, January 1, 2024 | 41033000000 | 19838200000 |
In pursuit of knowledge
In the ever-evolving landscape of global industries, understanding revenue trends is crucial for investors and analysts alike. This analysis delves into the revenue trajectories of Trane Technologies plc and Northrop Grumman Corporation from 2014 to 2023. Over this period, Northrop Grumman's revenue surged by approximately 64%, reflecting its robust growth in the defense sector. Meanwhile, Trane Technologies, a leader in climate solutions, saw its revenue increase by about 37%, showcasing its resilience and adaptability in a competitive market.
These insights highlight the dynamic nature of these industries and the strategic maneuvers by these corporations to maintain their market positions.
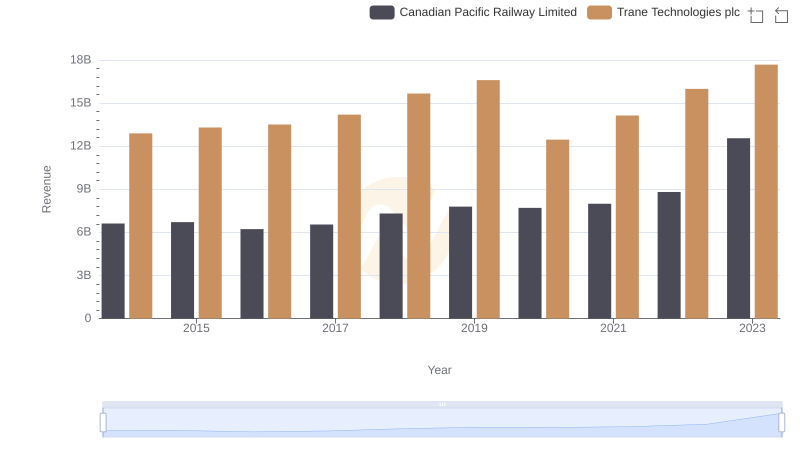
Revenue Showdown: Trane Technologies plc vs Canadian Pacific Railway Limited
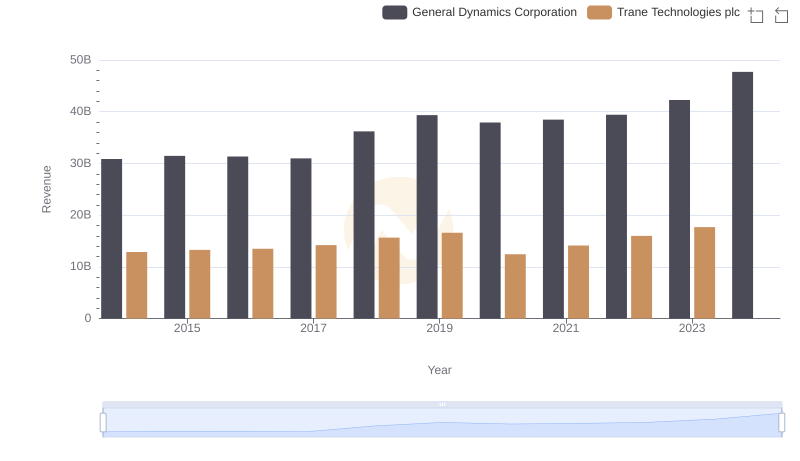
Trane Technologies plc vs General Dynamics Corporation: Annual Revenue Growth Compared
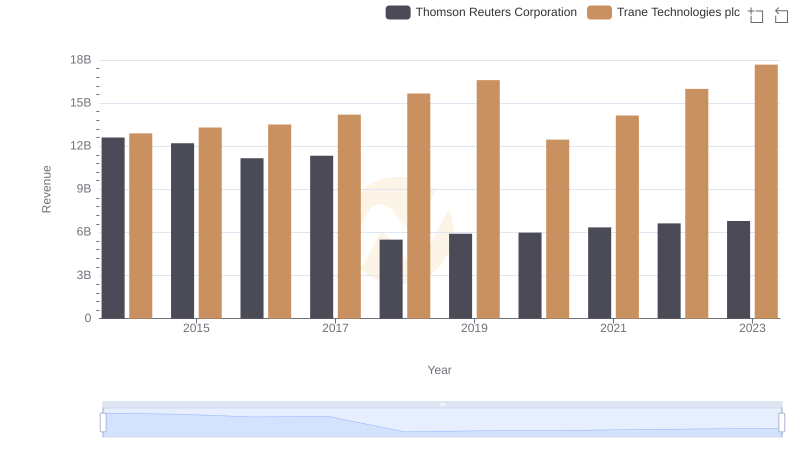
Annual Revenue Comparison: Trane Technologies plc vs Thomson Reuters Corporation
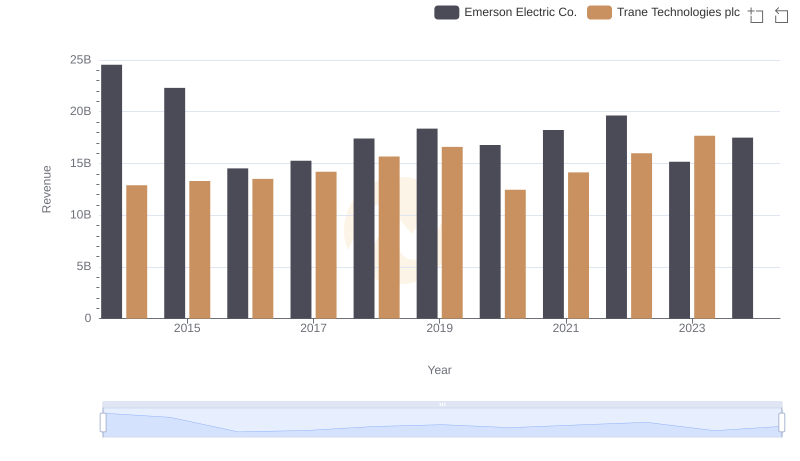
Revenue Insights: Trane Technologies plc and Emerson Electric Co. Performance Compared
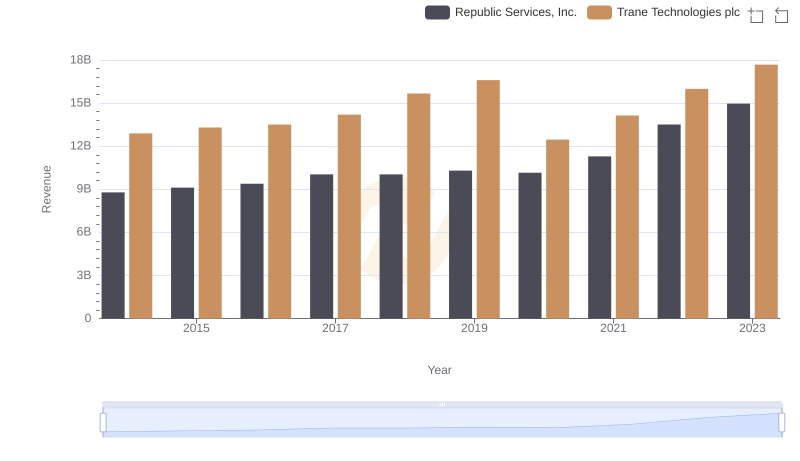
Revenue Insights: Trane Technologies plc and Republic Services, Inc. Performance Compared
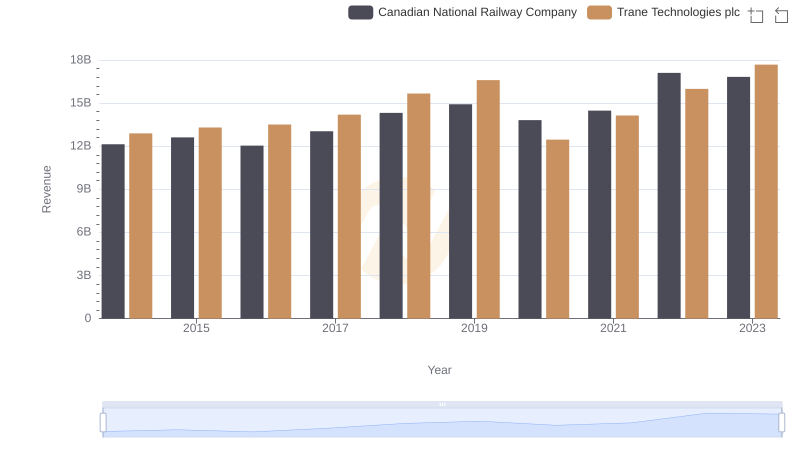
Trane Technologies plc and Canadian National Railway Company: A Comprehensive Revenue Analysis
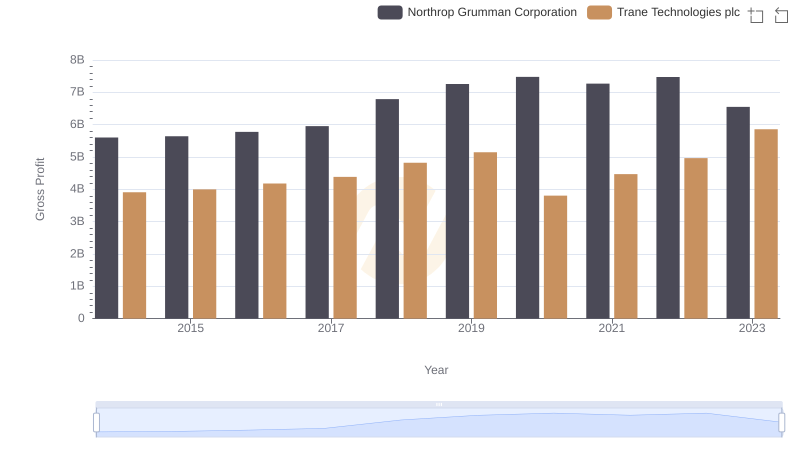
Trane Technologies plc and Northrop Grumman Corporation: A Detailed Gross Profit Analysis
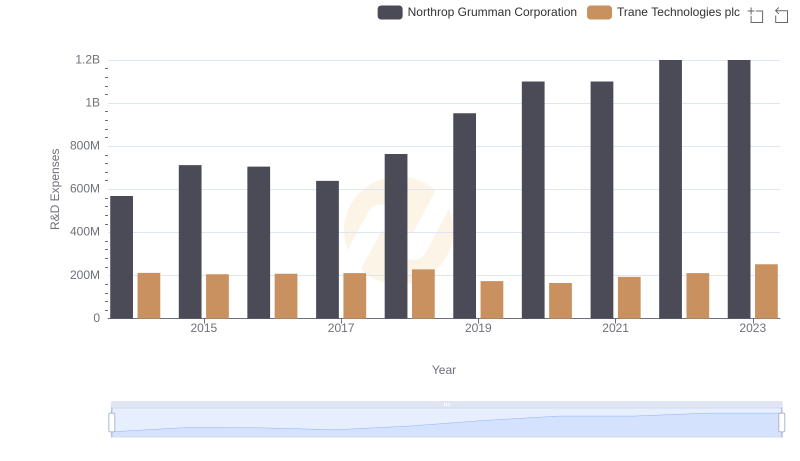
Who Prioritizes Innovation? R&D Spending Compared for Trane Technologies plc and Northrop Grumman Corporation
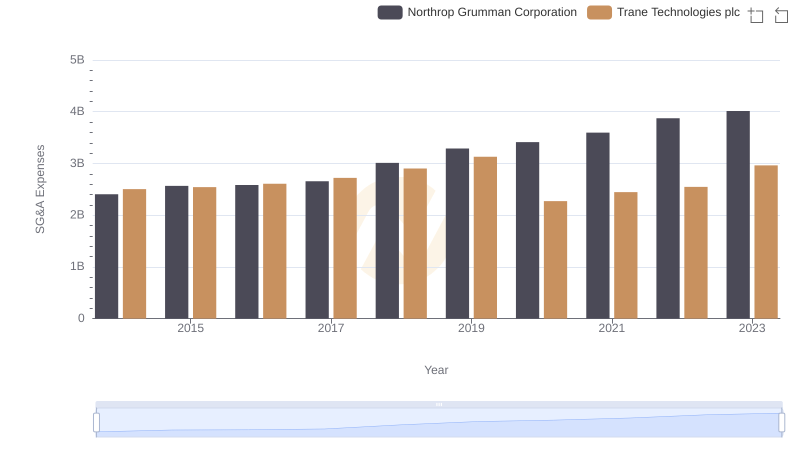
Trane Technologies plc vs Northrop Grumman Corporation: SG&A Expense Trends
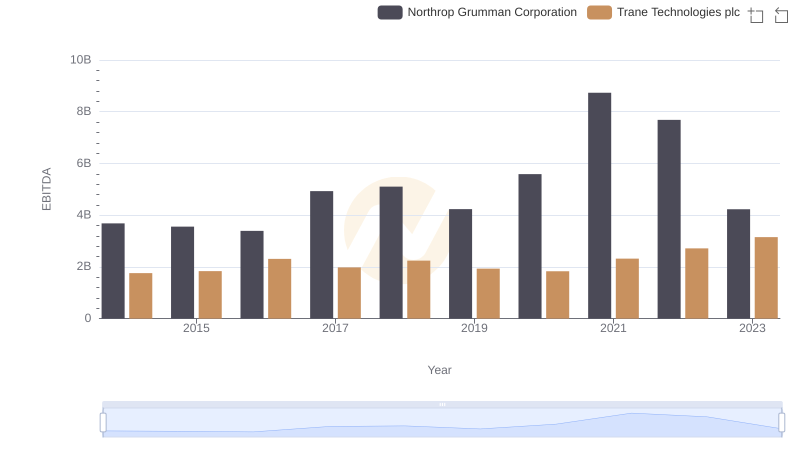
Trane Technologies plc and Northrop Grumman Corporation: A Detailed Examination of EBITDA Performance