| __timestamp | Lennox International Inc. | Trane Technologies plc |
|---|---|---|
| Wednesday, January 1, 2014 | 3367400000 | 12891400000 |
| Thursday, January 1, 2015 | 3467400000 | 13300700000 |
| Friday, January 1, 2016 | 3641600000 | 13508900000 |
| Sunday, January 1, 2017 | 3839600000 | 14197600000 |
| Monday, January 1, 2018 | 3883900000 | 15668200000 |
| Tuesday, January 1, 2019 | 3807200000 | 16598900000 |
| Wednesday, January 1, 2020 | 3634100000 | 12454700000 |
| Friday, January 1, 2021 | 4194100000 | 14136400000 |
| Saturday, January 1, 2022 | 4718400000 | 15991700000 |
| Sunday, January 1, 2023 | 4981900000 | 17677600000 |
| Monday, January 1, 2024 | 5341300000 | 19838200000 |
Data in motion
In the competitive landscape of the HVAC industry, Trane Technologies plc and Lennox International Inc. have been pivotal players. Over the past decade, Trane Technologies has consistently outperformed Lennox International in terms of revenue, boasting figures that are approximately three times higher. From 2014 to 2023, Trane Technologies saw a robust growth trajectory, peaking in 2023 with a revenue increase of nearly 37% from 2014. Lennox International, while trailing, demonstrated a steady upward trend, achieving a 59% revenue growth over the same period. Notably, 2024 data for Trane Technologies is missing, leaving room for speculation on its future performance. This comparison not only highlights the resilience and strategic prowess of these companies but also underscores the dynamic nature of the HVAC market. As the industry evolves, these giants continue to set benchmarks for innovation and growth.
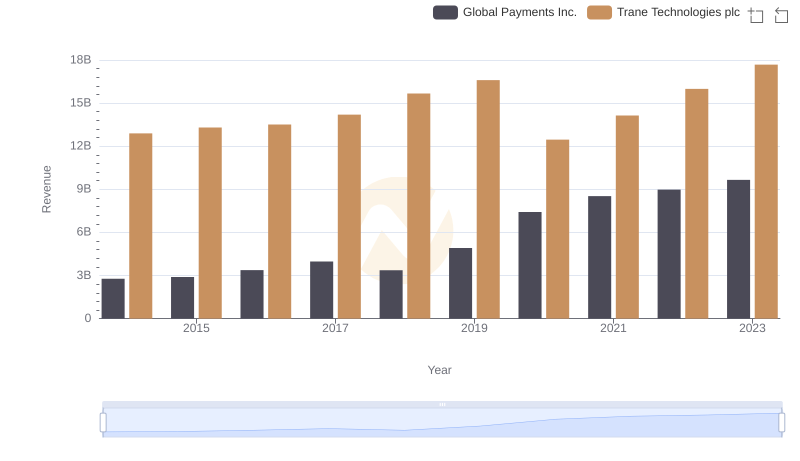
Trane Technologies plc and Global Payments Inc.: A Comprehensive Revenue Analysis
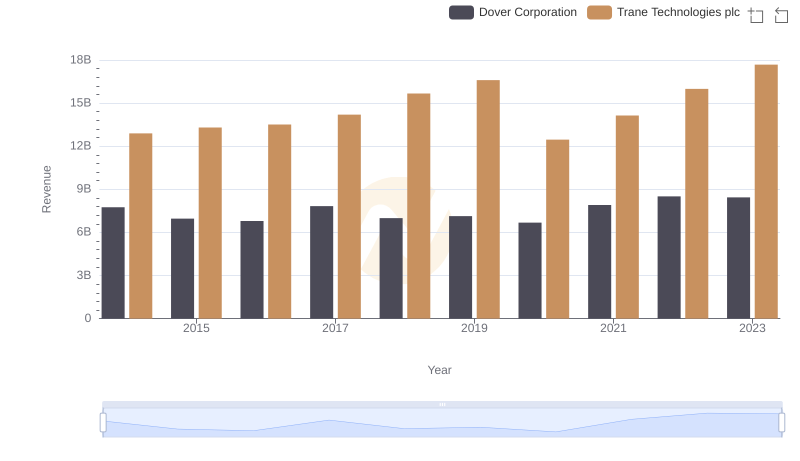
Annual Revenue Comparison: Trane Technologies plc vs Dover Corporation
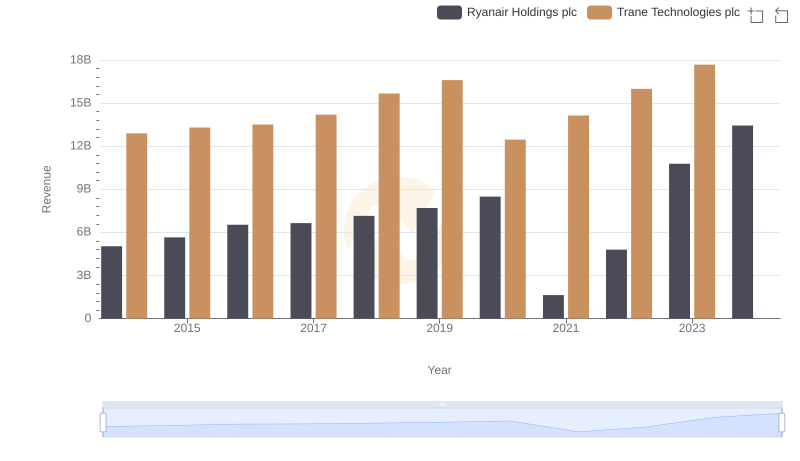
Annual Revenue Comparison: Trane Technologies plc vs Ryanair Holdings plc
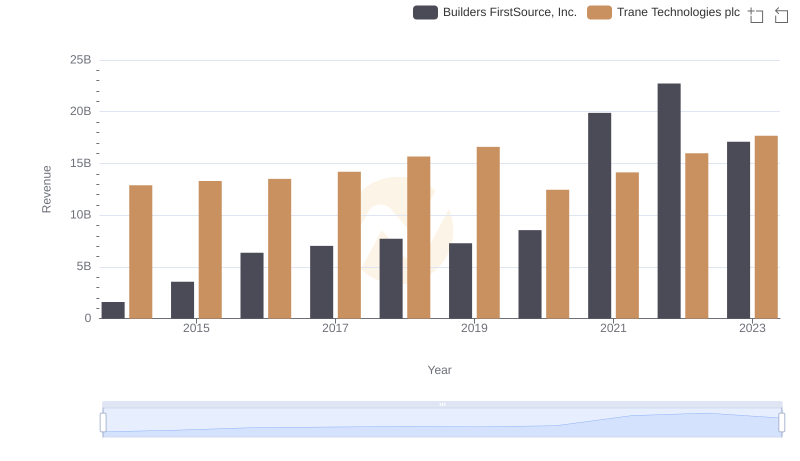
Trane Technologies plc vs Builders FirstSource, Inc.: Examining Key Revenue Metrics

Breaking Down Revenue Trends: Trane Technologies plc vs Hubbell Incorporated
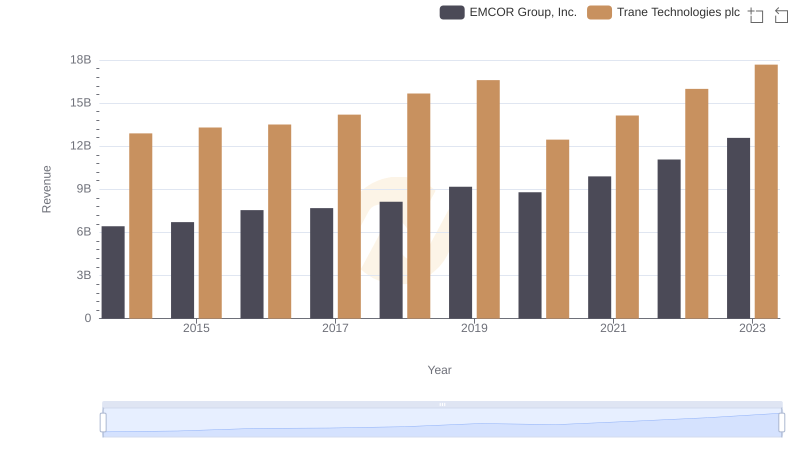
Trane Technologies plc and EMCOR Group, Inc.: A Comprehensive Revenue Analysis
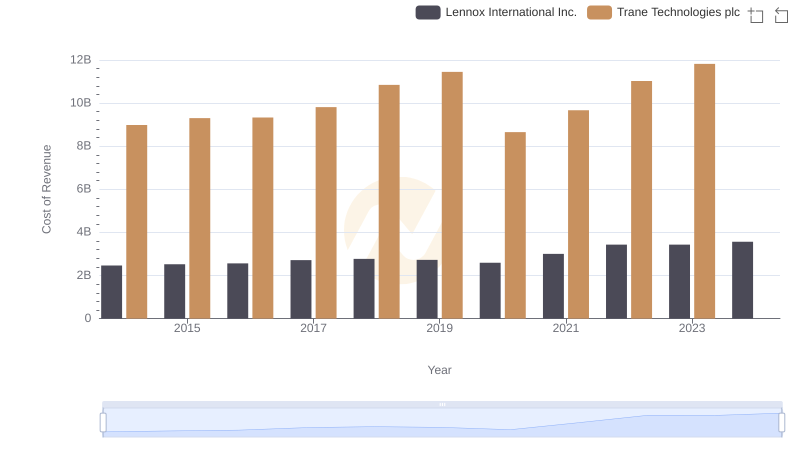
Cost Insights: Breaking Down Trane Technologies plc and Lennox International Inc.'s Expenses
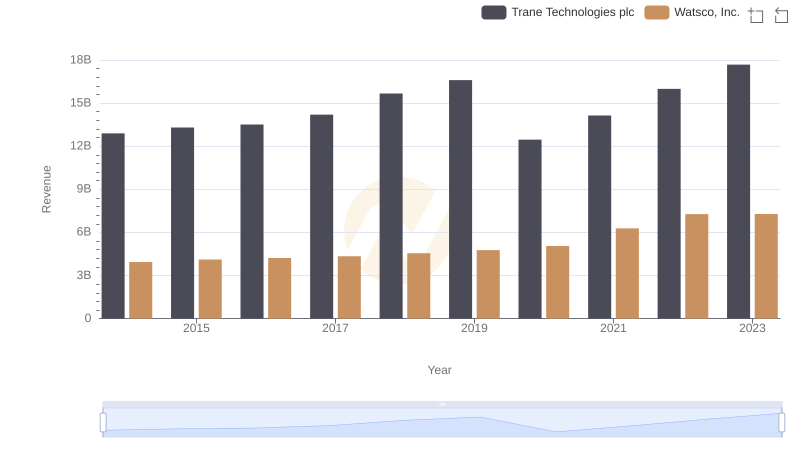
Trane Technologies plc or Watsco, Inc.: Who Leads in Yearly Revenue?
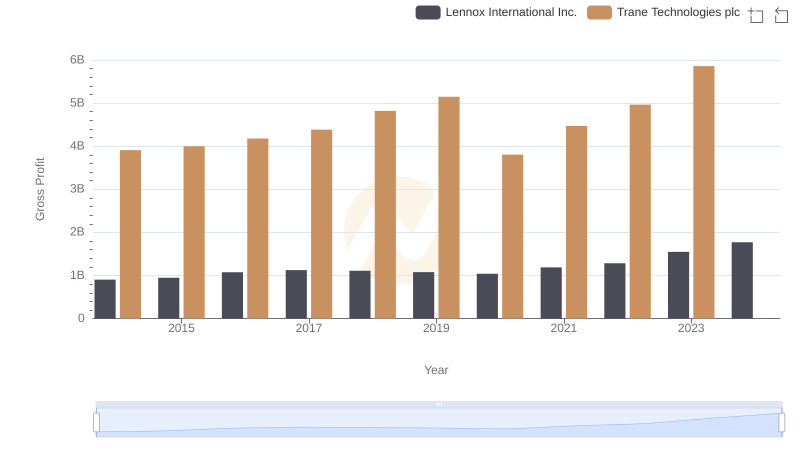
Trane Technologies plc and Lennox International Inc.: A Detailed Gross Profit Analysis
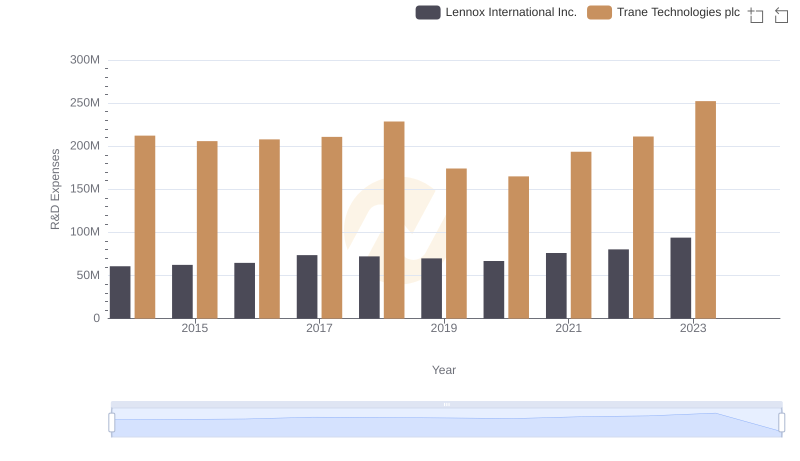
R&D Spending Showdown: Trane Technologies plc vs Lennox International Inc.
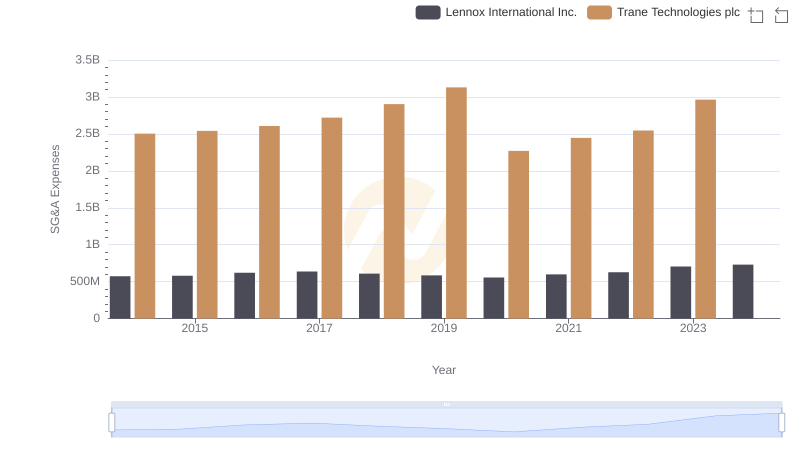
Selling, General, and Administrative Costs: Trane Technologies plc vs Lennox International Inc.
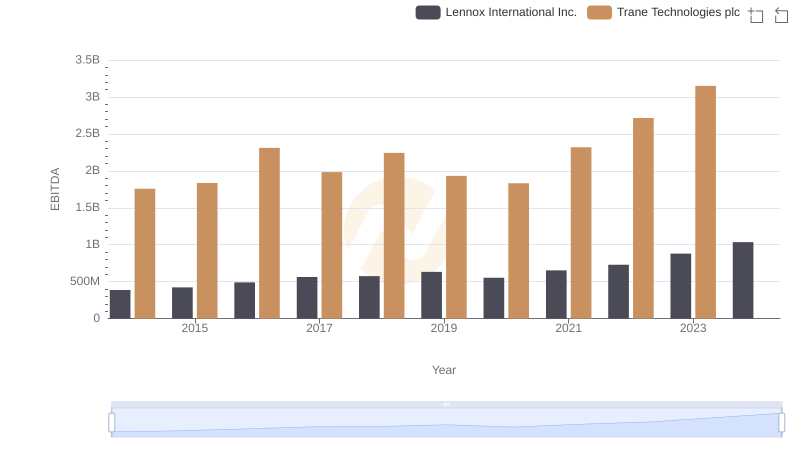
EBITDA Analysis: Evaluating Trane Technologies plc Against Lennox International Inc.