| __timestamp | Global Payments Inc. | Trane Technologies plc |
|---|---|---|
| Wednesday, January 1, 2014 | 2773718000 | 12891400000 |
| Thursday, January 1, 2015 | 2898150000 | 13300700000 |
| Friday, January 1, 2016 | 3370976000 | 13508900000 |
| Sunday, January 1, 2017 | 3975163000 | 14197600000 |
| Monday, January 1, 2018 | 3366366000 | 15668200000 |
| Tuesday, January 1, 2019 | 4911892000 | 16598900000 |
| Wednesday, January 1, 2020 | 7423558000 | 12454700000 |
| Friday, January 1, 2021 | 8523762000 | 14136400000 |
| Saturday, January 1, 2022 | 8975515000 | 15991700000 |
| Sunday, January 1, 2023 | 9654419000 | 17677600000 |
| Monday, January 1, 2024 | 10105894000 | 19838200000 |
Cracking the code
In the ever-evolving landscape of global business, understanding revenue trends is crucial. Over the past decade, Trane Technologies plc and Global Payments Inc. have demonstrated remarkable growth trajectories. From 2014 to 2023, Trane Technologies plc saw its revenue increase by approximately 37%, reaching a peak in 2023. This growth underscores its robust market position and strategic initiatives.
Conversely, Global Payments Inc. experienced an impressive revenue surge of nearly 248% over the same period, highlighting its dynamic expansion in the financial services sector. Notably, the year 2020 marked a significant leap for Global Payments, with a 51% increase from the previous year, reflecting its adaptability in challenging times.
These insights reveal the contrasting yet successful strategies of both companies, offering valuable lessons in resilience and innovation in the face of global economic shifts.
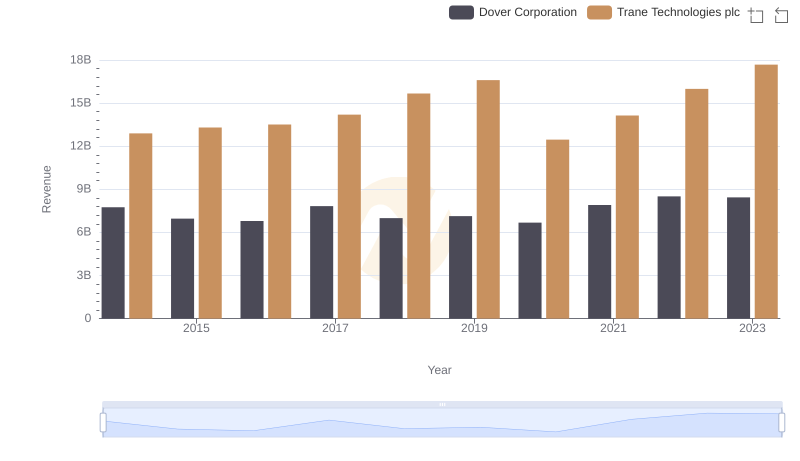
Annual Revenue Comparison: Trane Technologies plc vs Dover Corporation
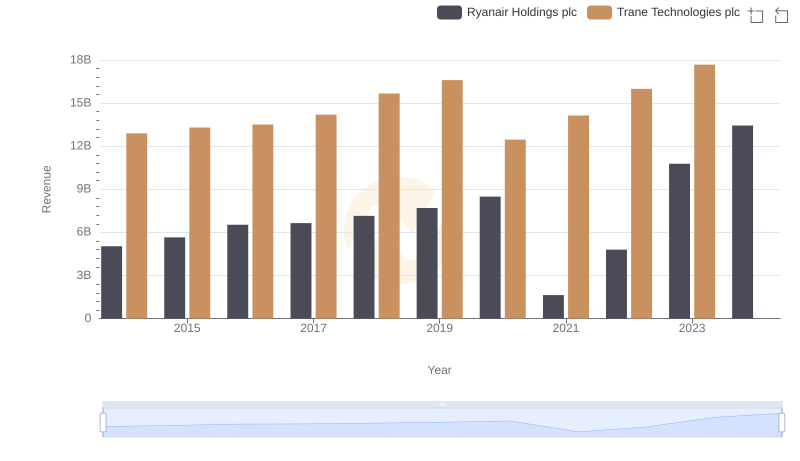
Annual Revenue Comparison: Trane Technologies plc vs Ryanair Holdings plc
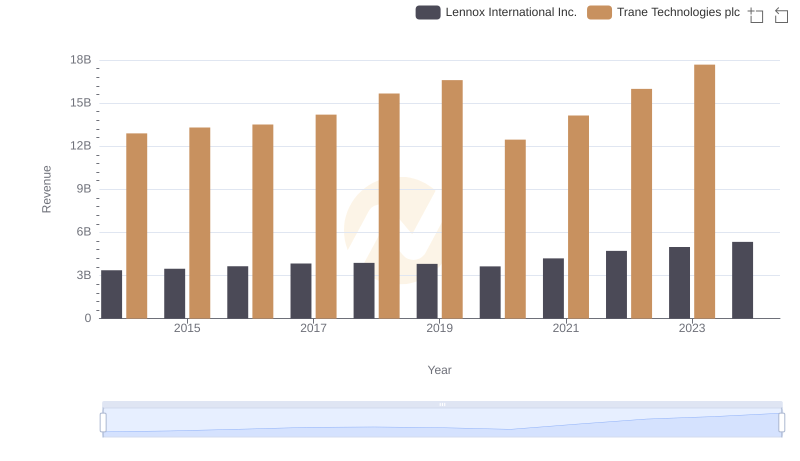
Trane Technologies plc vs Lennox International Inc.: Examining Key Revenue Metrics
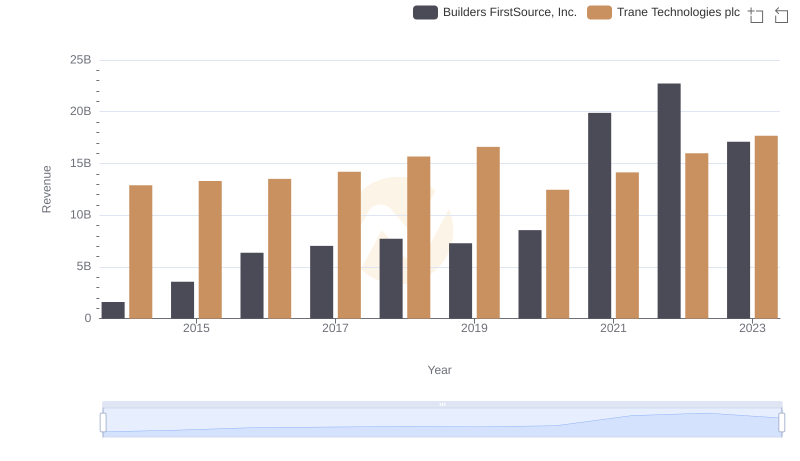
Trane Technologies plc vs Builders FirstSource, Inc.: Examining Key Revenue Metrics

Breaking Down Revenue Trends: Trane Technologies plc vs Hubbell Incorporated
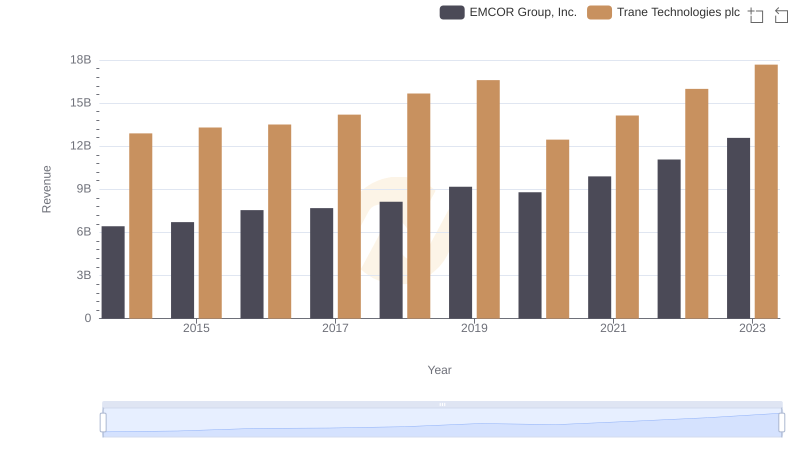
Trane Technologies plc and EMCOR Group, Inc.: A Comprehensive Revenue Analysis
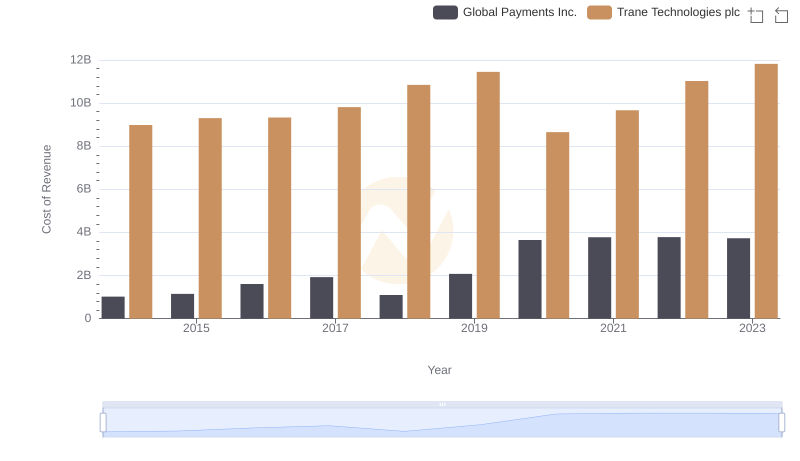
Cost of Revenue Comparison: Trane Technologies plc vs Global Payments Inc.
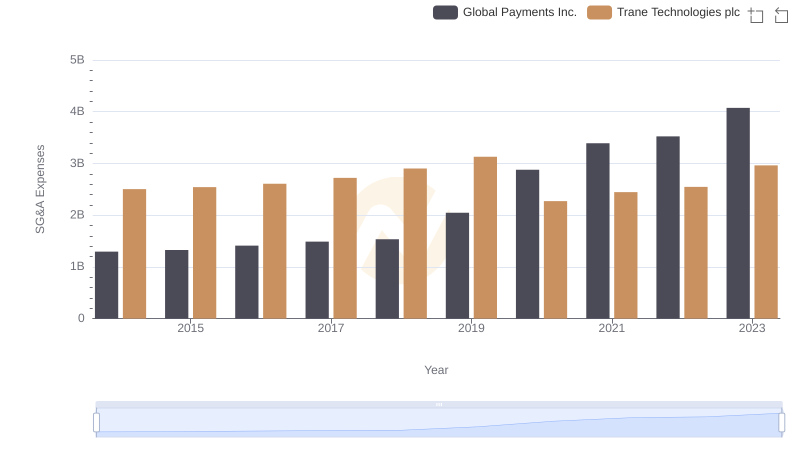
Breaking Down SG&A Expenses: Trane Technologies plc vs Global Payments Inc.
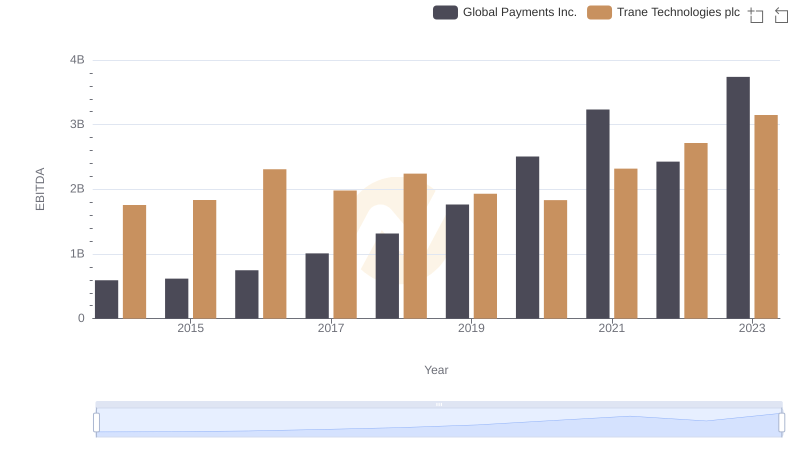
Comparative EBITDA Analysis: Trane Technologies plc vs Global Payments Inc.