| __timestamp | Lennox International Inc. | Trane Technologies plc |
|---|---|---|
| Wednesday, January 1, 2014 | 573700000 | 2503900000 |
| Thursday, January 1, 2015 | 580500000 | 2541100000 |
| Friday, January 1, 2016 | 621000000 | 2606500000 |
| Sunday, January 1, 2017 | 637700000 | 2720700000 |
| Monday, January 1, 2018 | 608200000 | 2903200000 |
| Tuesday, January 1, 2019 | 585900000 | 3129800000 |
| Wednesday, January 1, 2020 | 555900000 | 2270600000 |
| Friday, January 1, 2021 | 598900000 | 2446300000 |
| Saturday, January 1, 2022 | 627200000 | 2545900000 |
| Sunday, January 1, 2023 | 705500000 | 2963200000 |
| Monday, January 1, 2024 | 730600000 | 3580400000 |
Unlocking the unknown
In the competitive landscape of the HVAC industry, understanding the financial dynamics of key players is crucial. Over the past decade, Trane Technologies plc and Lennox International Inc. have showcased distinct trends in their Selling, General, and Administrative (SG&A) expenses. From 2014 to 2023, Trane Technologies consistently reported higher SG&A costs, peaking in 2019 with a 25% increase from 2014. In contrast, Lennox International's expenses grew more modestly, with a notable 23% rise by 2024. Interestingly, 2020 marked a dip for both companies, likely reflecting global economic shifts. While Trane's data for 2024 remains incomplete, Lennox's continued growth suggests strategic investments in operational efficiency. This analysis not only highlights the financial strategies of these industry giants but also offers insights into their adaptive measures in a fluctuating market.
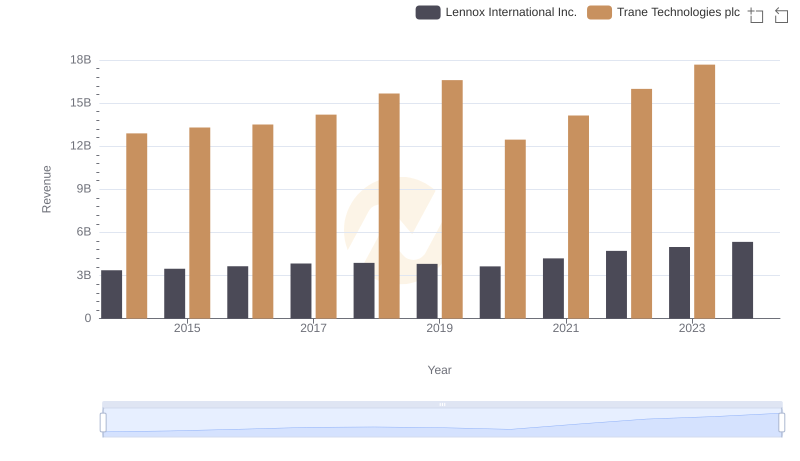
Trane Technologies plc vs Lennox International Inc.: Examining Key Revenue Metrics
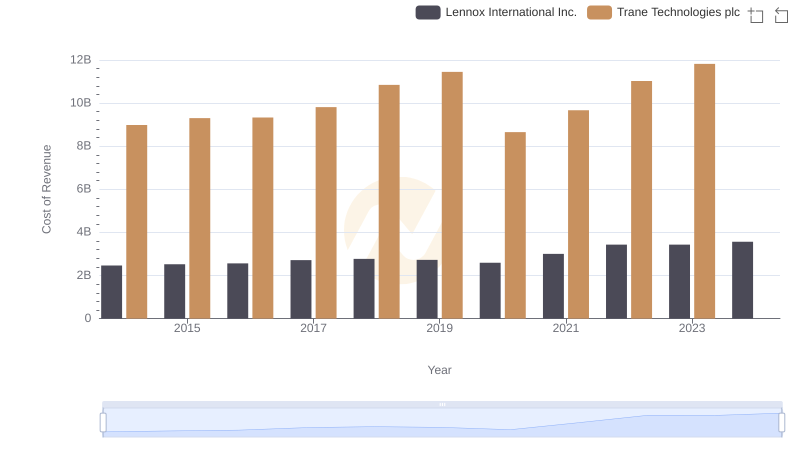
Cost Insights: Breaking Down Trane Technologies plc and Lennox International Inc.'s Expenses
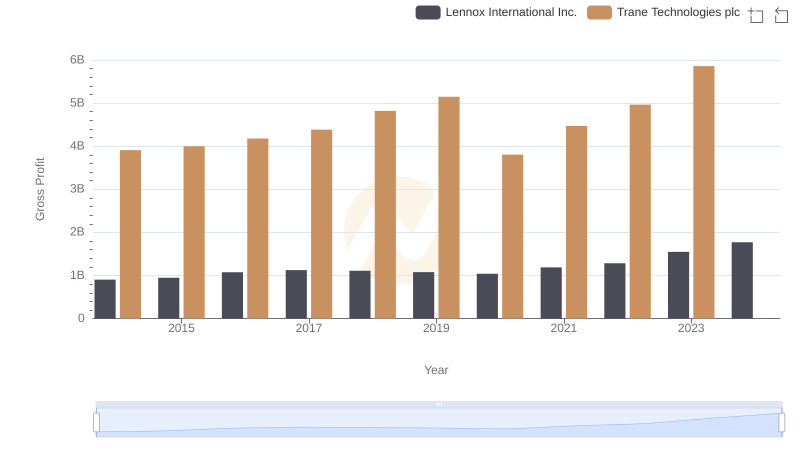
Trane Technologies plc and Lennox International Inc.: A Detailed Gross Profit Analysis
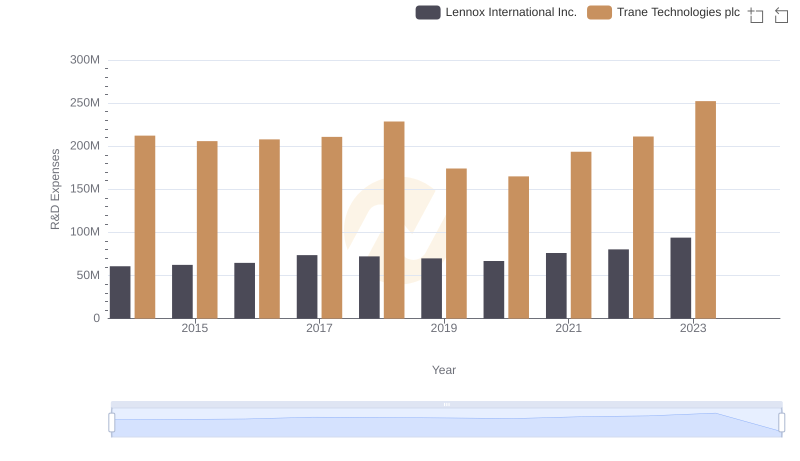
R&D Spending Showdown: Trane Technologies plc vs Lennox International Inc.

Trane Technologies plc and Xylem Inc.: SG&A Spending Patterns Compared
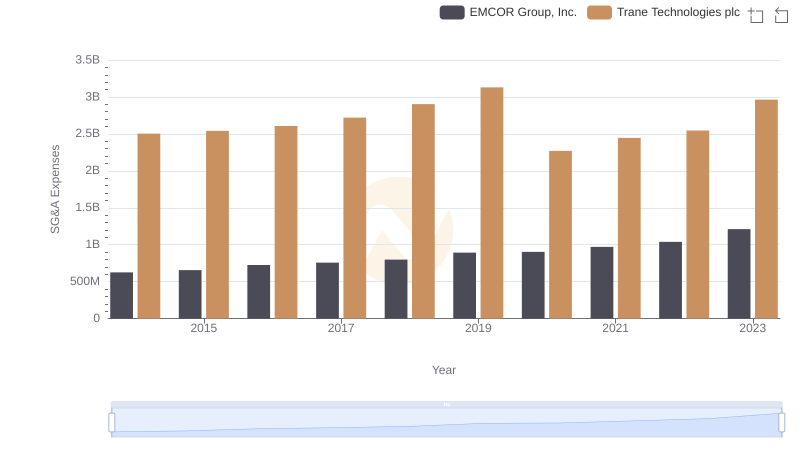
Trane Technologies plc vs EMCOR Group, Inc.: SG&A Expense Trends
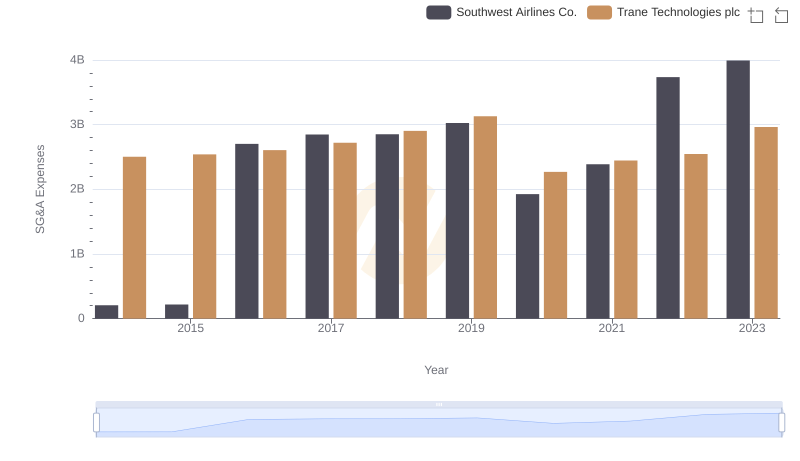
Operational Costs Compared: SG&A Analysis of Trane Technologies plc and Southwest Airlines Co.
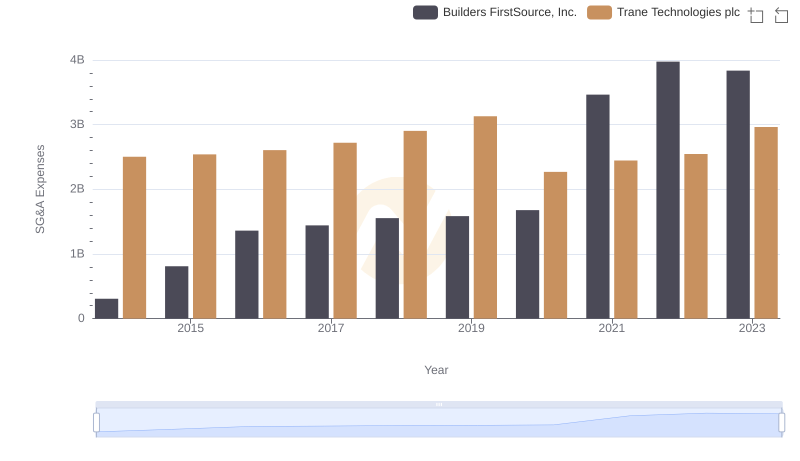
Cost Management Insights: SG&A Expenses for Trane Technologies plc and Builders FirstSource, Inc.
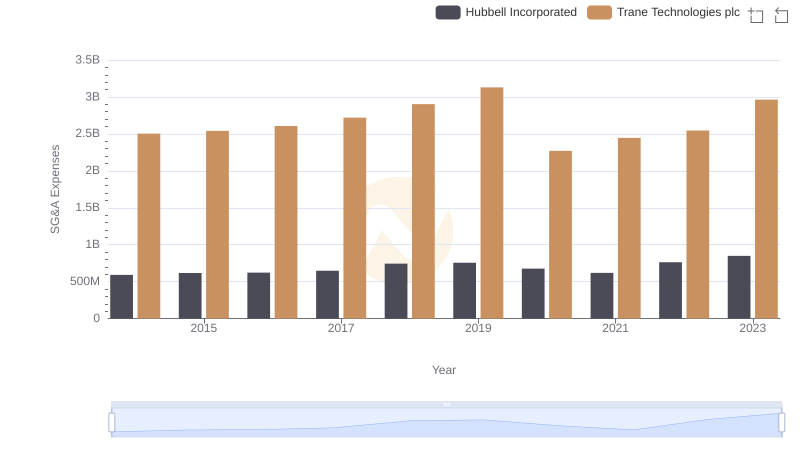
SG&A Efficiency Analysis: Comparing Trane Technologies plc and Hubbell Incorporated

Cost Management Insights: SG&A Expenses for Trane Technologies plc and Watsco, Inc.
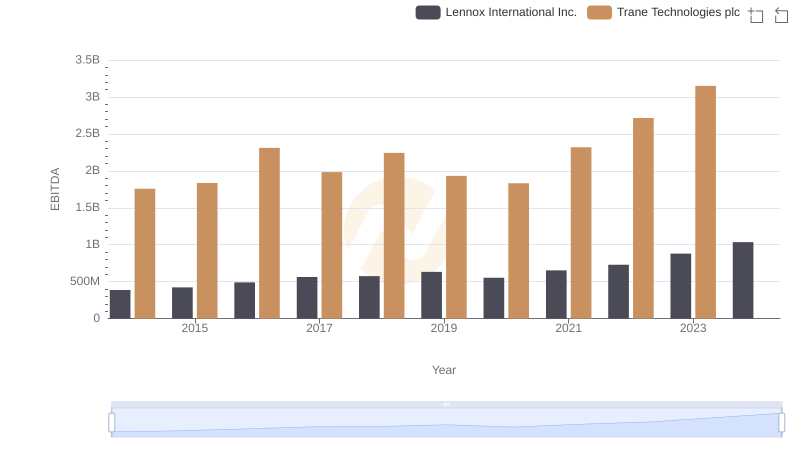
EBITDA Analysis: Evaluating Trane Technologies plc Against Lennox International Inc.