| __timestamp | Dover Corporation | Trane Technologies plc |
|---|---|---|
| Wednesday, January 1, 2014 | 7752728000 | 12891400000 |
| Thursday, January 1, 2015 | 6956311000 | 13300700000 |
| Friday, January 1, 2016 | 6794342000 | 13508900000 |
| Sunday, January 1, 2017 | 7830436000 | 14197600000 |
| Monday, January 1, 2018 | 6992118000 | 15668200000 |
| Tuesday, January 1, 2019 | 7136397000 | 16598900000 |
| Wednesday, January 1, 2020 | 6683760000 | 12454700000 |
| Friday, January 1, 2021 | 7907081000 | 14136400000 |
| Saturday, January 1, 2022 | 8508088000 | 15991700000 |
| Sunday, January 1, 2023 | 8438134000 | 17677600000 |
| Monday, January 1, 2024 | 7745909000 | 19838200000 |
Unleashing the power of data
In the ever-evolving landscape of industrial innovation, Trane Technologies plc and Dover Corporation have emerged as formidable players. Over the past decade, from 2014 to 2023, these companies have demonstrated remarkable resilience and growth in their annual revenues. Trane Technologies, a leader in climate innovation, has seen its revenue soar by approximately 37%, reaching a peak in 2023. Meanwhile, Dover Corporation, known for its diversified industrial products, has experienced a steady revenue increase of around 9% over the same period.
These trends highlight the dynamic nature of the industrial sector and the strategic maneuvers by these corporations to adapt and thrive.
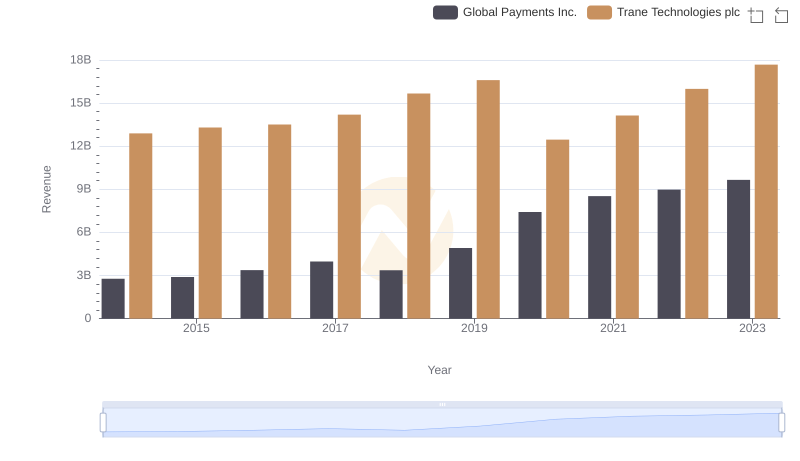
Trane Technologies plc and Global Payments Inc.: A Comprehensive Revenue Analysis
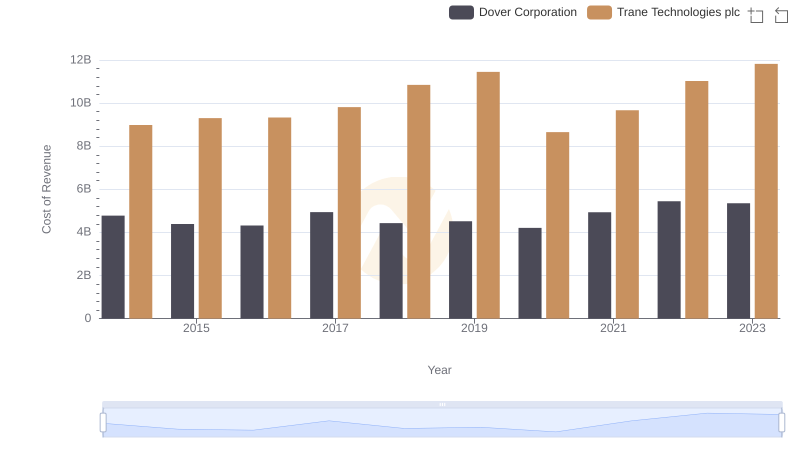
Cost of Revenue: Key Insights for Trane Technologies plc and Dover Corporation
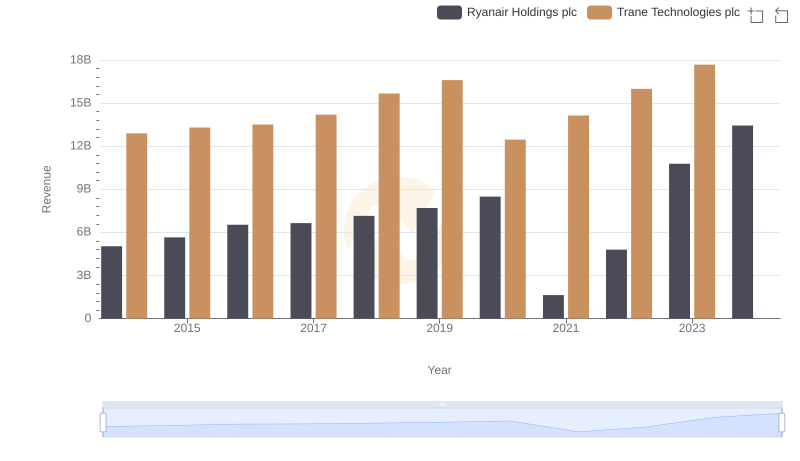
Annual Revenue Comparison: Trane Technologies plc vs Ryanair Holdings plc
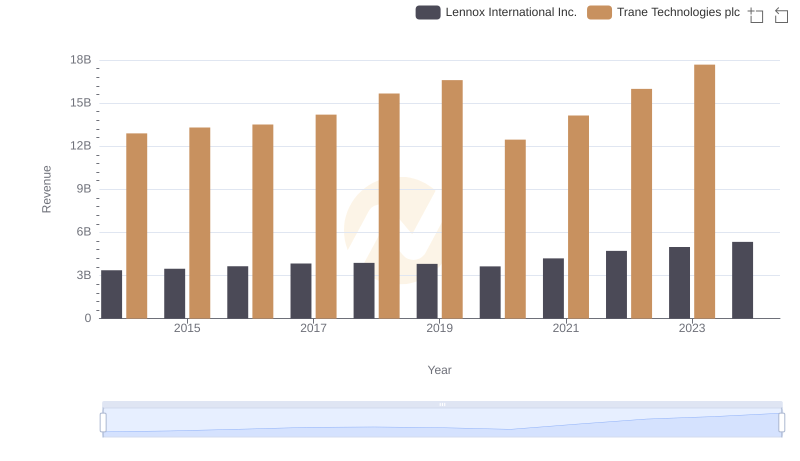
Trane Technologies plc vs Lennox International Inc.: Examining Key Revenue Metrics
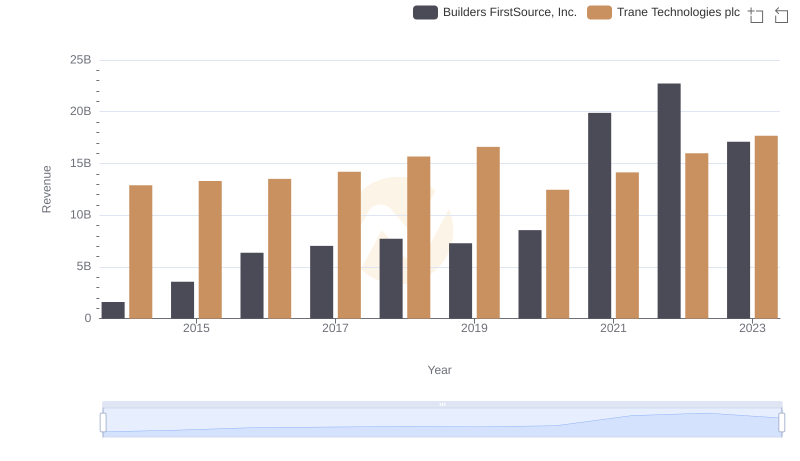
Trane Technologies plc vs Builders FirstSource, Inc.: Examining Key Revenue Metrics

Breaking Down Revenue Trends: Trane Technologies plc vs Hubbell Incorporated
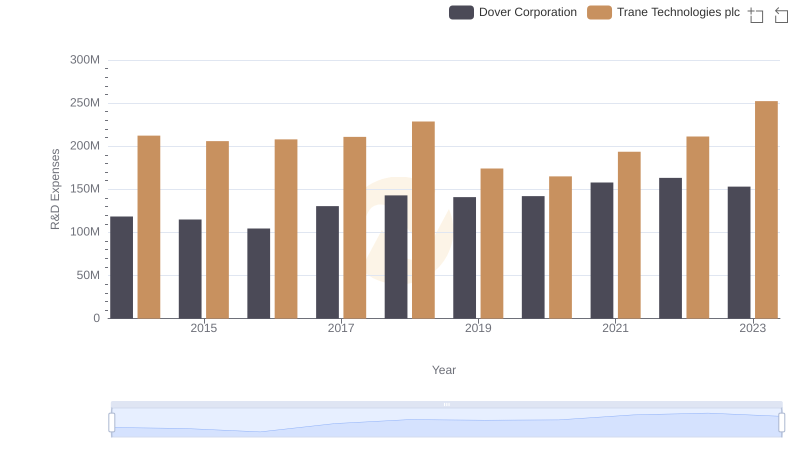
Trane Technologies plc vs Dover Corporation: Strategic Focus on R&D Spending
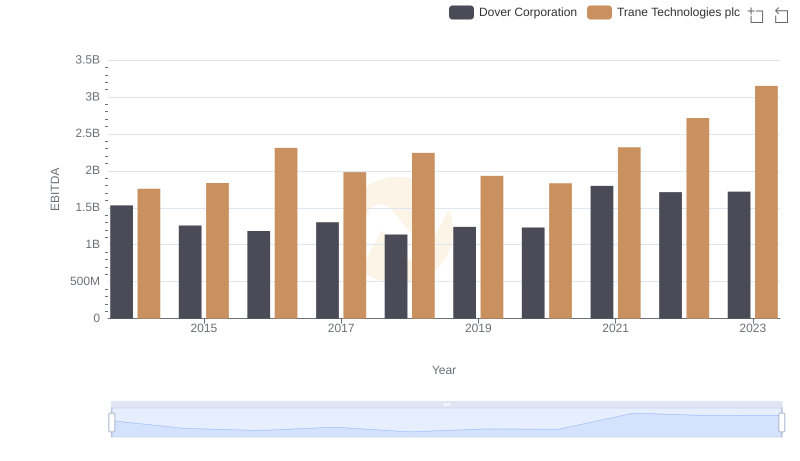
A Side-by-Side Analysis of EBITDA: Trane Technologies plc and Dover Corporation