| __timestamp | Lennox International Inc. | Trane Technologies plc |
|---|---|---|
| Wednesday, January 1, 2014 | 387700000 | 1757000000 |
| Thursday, January 1, 2015 | 423600000 | 1835000000 |
| Friday, January 1, 2016 | 490800000 | 2311000000 |
| Sunday, January 1, 2017 | 562900000 | 1982500000 |
| Monday, January 1, 2018 | 575200000 | 2242400000 |
| Tuesday, January 1, 2019 | 633300000 | 1931200000 |
| Wednesday, January 1, 2020 | 553900000 | 1831900000 |
| Friday, January 1, 2021 | 652500000 | 2319200000 |
| Saturday, January 1, 2022 | 729000000 | 2715500000 |
| Sunday, January 1, 2023 | 879500000 | 3149900000 |
| Monday, January 1, 2024 | 1034800000 | 3859600000 |
In pursuit of knowledge
In the competitive landscape of the HVAC industry, Trane Technologies plc and Lennox International Inc. have been pivotal players. Over the past decade, Trane Technologies has consistently outperformed Lennox International in terms of EBITDA, showcasing a robust growth trajectory. From 2014 to 2023, Trane Technologies' EBITDA surged by approximately 79%, peaking in 2023, while Lennox International saw a commendable 127% increase, reaching its highest in 2024. This growth reflects strategic investments and market adaptability. Notably, Trane Technologies' EBITDA in 2023 was nearly 3.15 times that of Lennox International in 2014, highlighting its dominant market position. However, the absence of data for Trane Technologies in 2024 leaves room for speculation about its future performance. As the industry evolves, these companies' financial strategies will be crucial in maintaining their competitive edge.
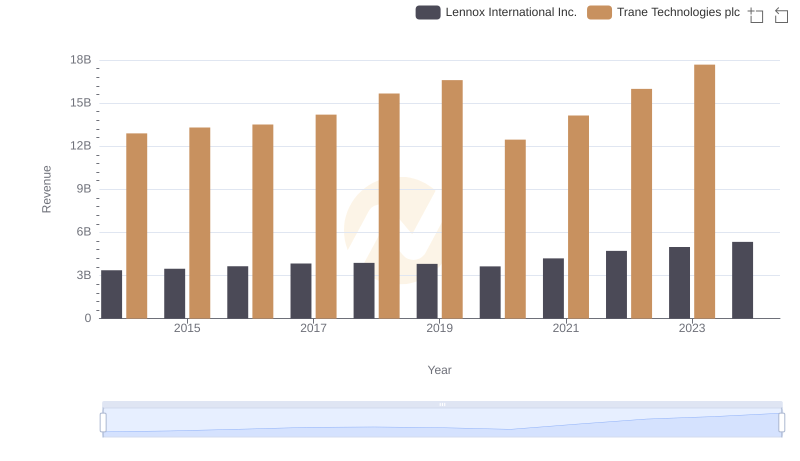
Trane Technologies plc vs Lennox International Inc.: Examining Key Revenue Metrics
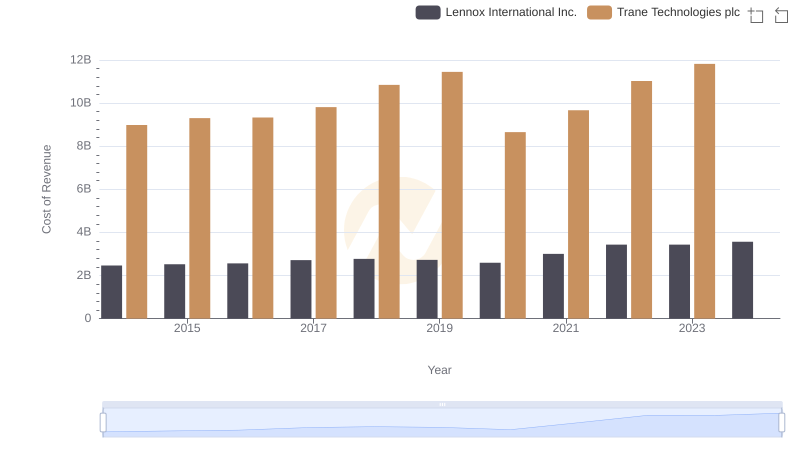
Cost Insights: Breaking Down Trane Technologies plc and Lennox International Inc.'s Expenses
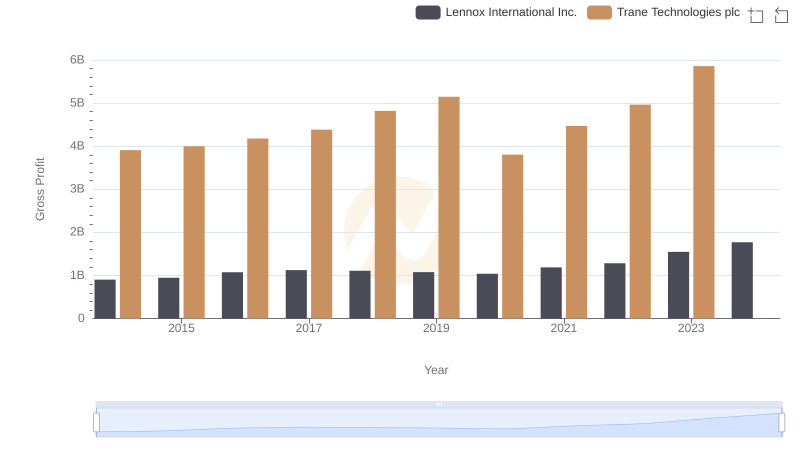
Trane Technologies plc and Lennox International Inc.: A Detailed Gross Profit Analysis
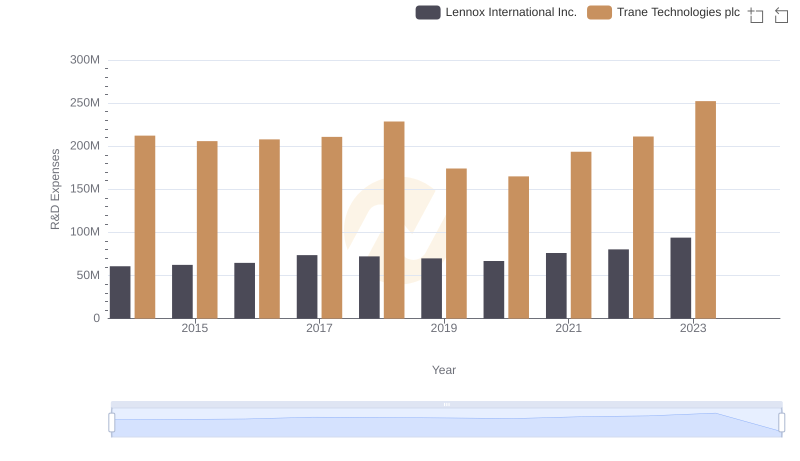
R&D Spending Showdown: Trane Technologies plc vs Lennox International Inc.
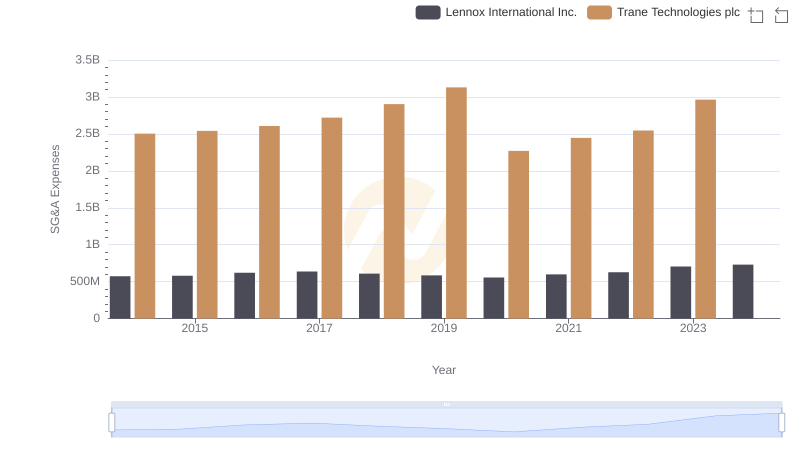
Selling, General, and Administrative Costs: Trane Technologies plc vs Lennox International Inc.
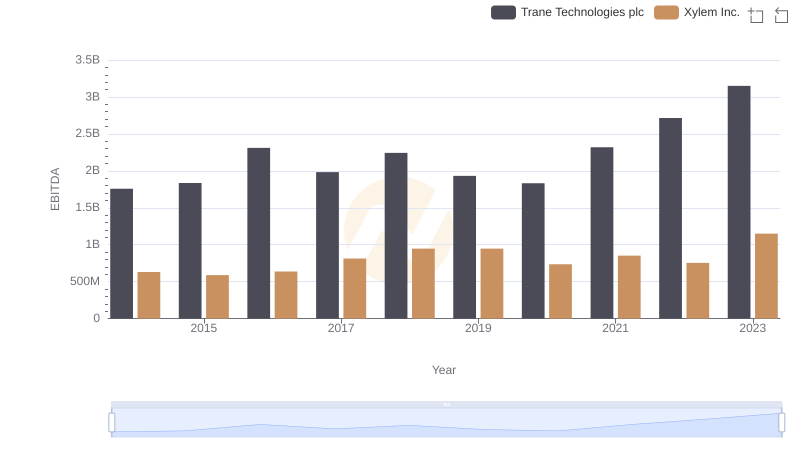
A Professional Review of EBITDA: Trane Technologies plc Compared to Xylem Inc.
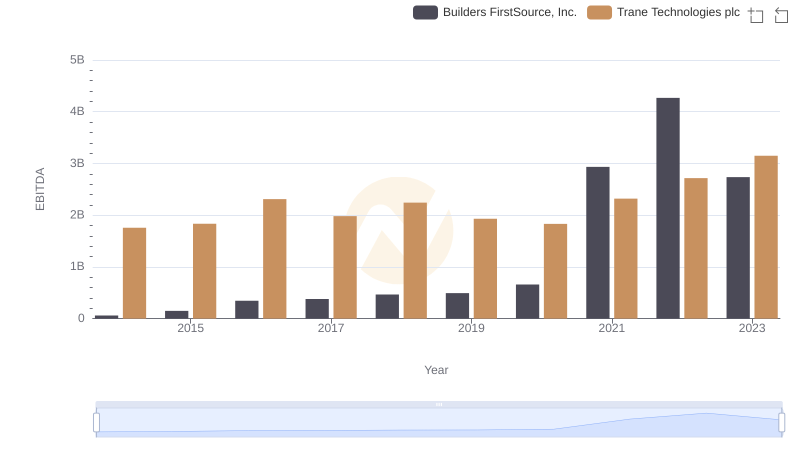
EBITDA Metrics Evaluated: Trane Technologies plc vs Builders FirstSource, Inc.
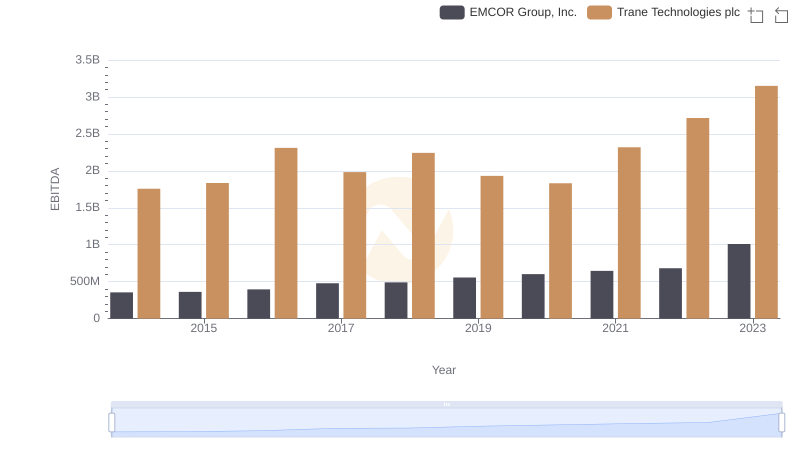
A Professional Review of EBITDA: Trane Technologies plc Compared to EMCOR Group, Inc.
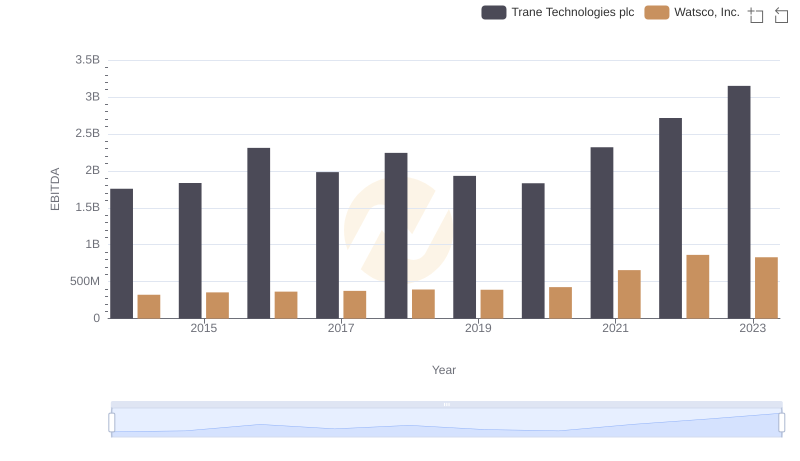
EBITDA Metrics Evaluated: Trane Technologies plc vs Watsco, Inc.
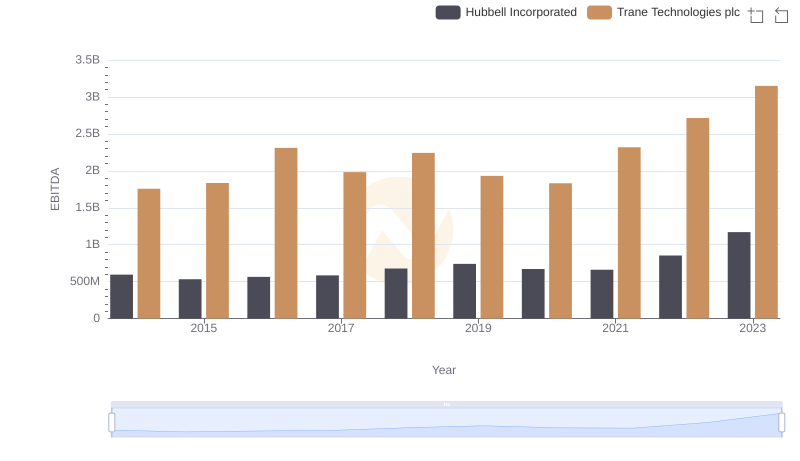
Trane Technologies plc and Hubbell Incorporated: A Detailed Examination of EBITDA Performance
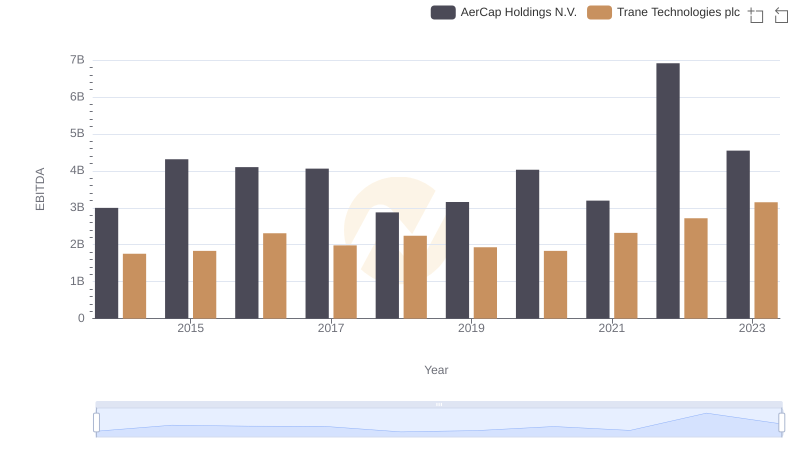
Comprehensive EBITDA Comparison: Trane Technologies plc vs AerCap Holdings N.V.

Trane Technologies plc vs TransUnion: In-Depth EBITDA Performance Comparison