| __timestamp | Ryanair Holdings plc | Trane Technologies plc |
|---|---|---|
| Wednesday, January 1, 2014 | 5036700000 | 12891400000 |
| Thursday, January 1, 2015 | 5654000000 | 13300700000 |
| Friday, January 1, 2016 | 6535800000 | 13508900000 |
| Sunday, January 1, 2017 | 6647800000 | 14197600000 |
| Monday, January 1, 2018 | 7151000000 | 15668200000 |
| Tuesday, January 1, 2019 | 7697400000 | 16598900000 |
| Wednesday, January 1, 2020 | 8494799999 | 12454700000 |
| Friday, January 1, 2021 | 1635800000 | 14136400000 |
| Saturday, January 1, 2022 | 4800900000 | 15991700000 |
| Sunday, January 1, 2023 | 10775200000 | 17677600000 |
| Monday, January 1, 2024 | 13443800000 | 19838200000 |
Unlocking the unknown
In the ever-evolving landscape of global business, Trane Technologies and Ryanair Holdings stand as titans in their respective industries. Over the past decade, these companies have showcased remarkable resilience and growth. Trane Technologies, a leader in climate solutions, consistently outperformed Ryanair in revenue, with a peak in 2023 reaching approximately 17.7 billion, marking a 37% increase from 2014. Meanwhile, Ryanair, Europe's largest airline by passenger numbers, experienced a rollercoaster ride, with revenues plummeting in 2021 due to the pandemic but rebounding sharply by 2023, achieving a 114% increase from its 2021 low.
This comparison highlights the diverse challenges and opportunities faced by companies in different sectors. While Trane Technologies maintained steady growth, Ryanair's recovery underscores the airline industry's volatility and resilience. Missing data for 2024 suggests ongoing developments, inviting investors and analysts to stay tuned for future insights.
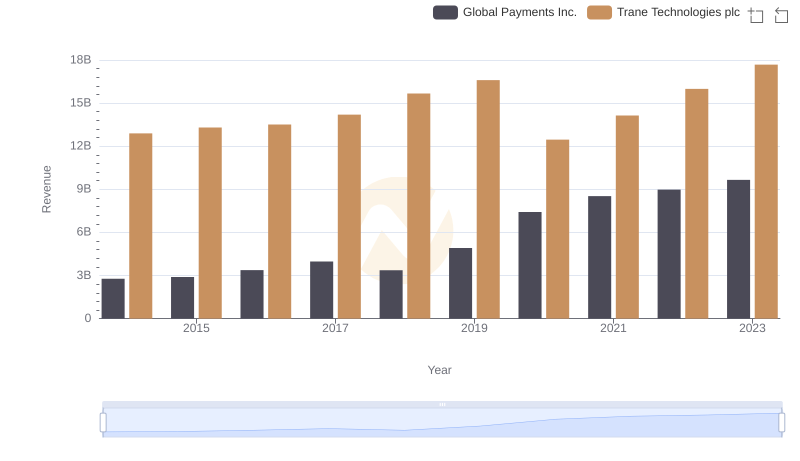
Trane Technologies plc and Global Payments Inc.: A Comprehensive Revenue Analysis
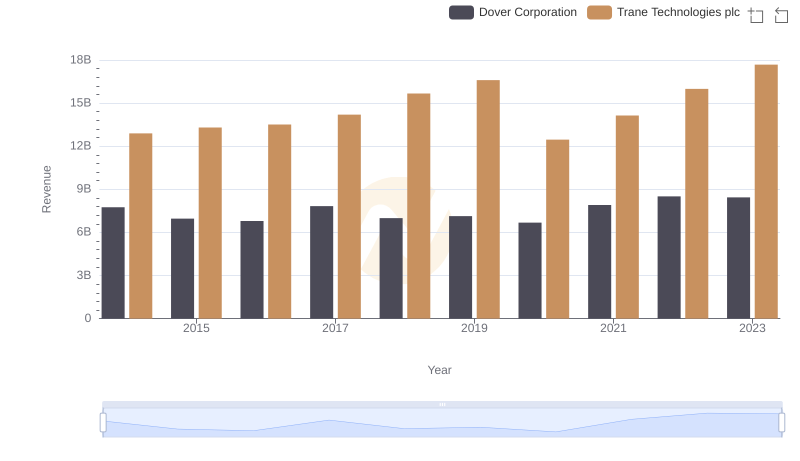
Annual Revenue Comparison: Trane Technologies plc vs Dover Corporation
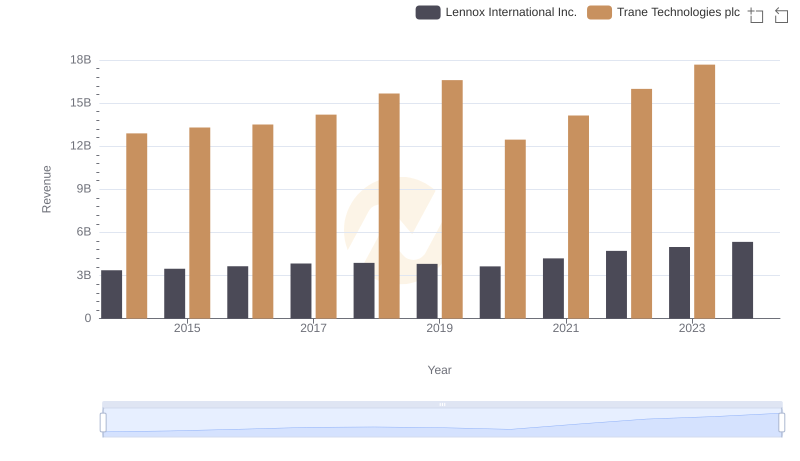
Trane Technologies plc vs Lennox International Inc.: Examining Key Revenue Metrics
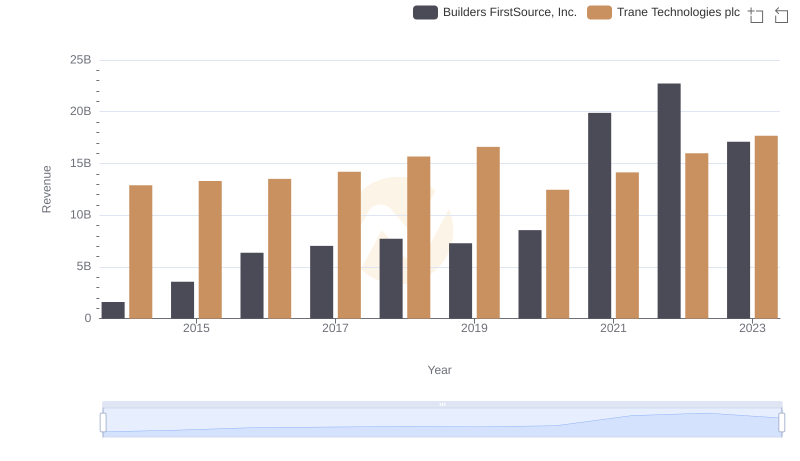
Trane Technologies plc vs Builders FirstSource, Inc.: Examining Key Revenue Metrics

Breaking Down Revenue Trends: Trane Technologies plc vs Hubbell Incorporated
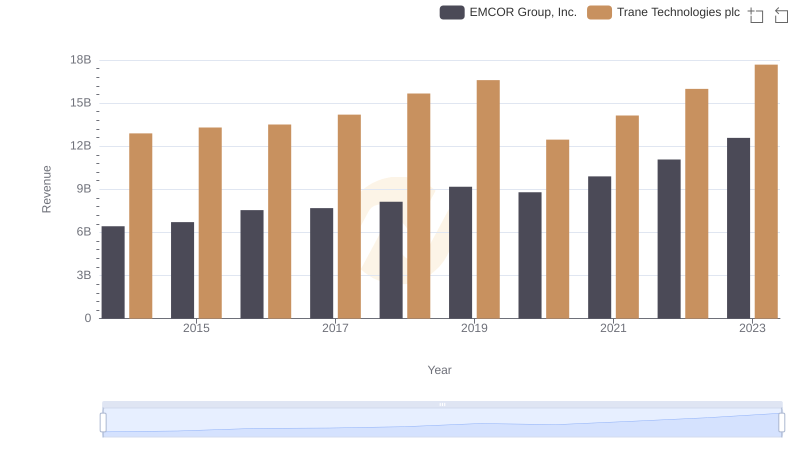
Trane Technologies plc and EMCOR Group, Inc.: A Comprehensive Revenue Analysis
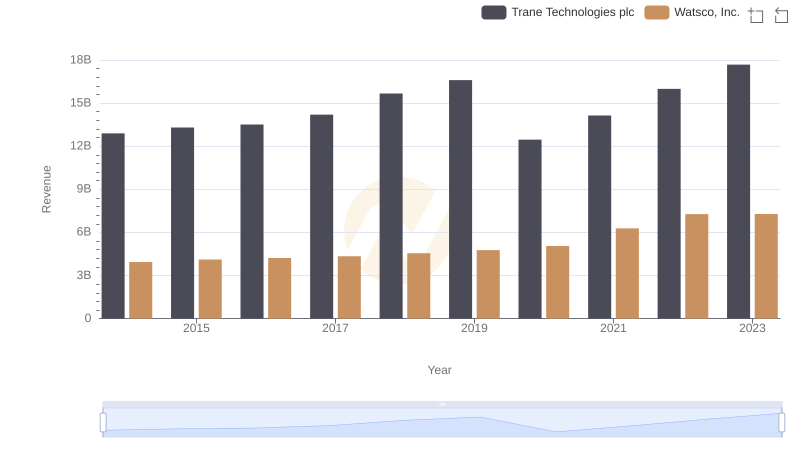
Trane Technologies plc or Watsco, Inc.: Who Leads in Yearly Revenue?
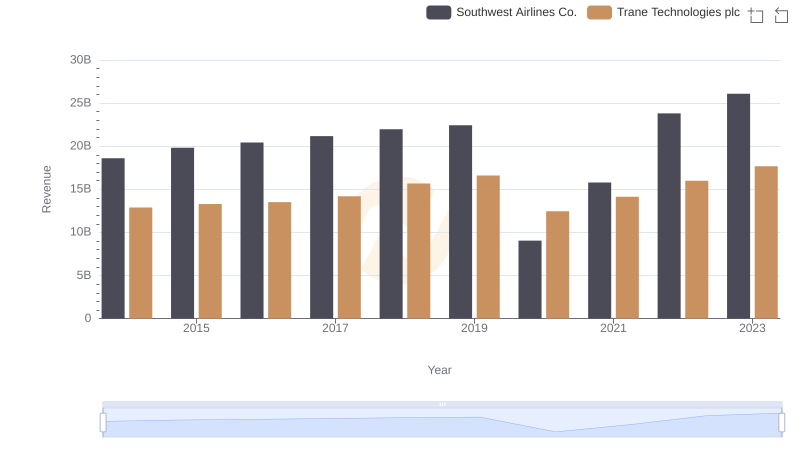
Comparing Revenue Performance: Trane Technologies plc or Southwest Airlines Co.?