| __timestamp | AMETEK, Inc. | Trane Technologies plc |
|---|---|---|
| Wednesday, January 1, 2014 | 1023344000 | 1757000000 |
| Thursday, January 1, 2015 | 1093776000 | 1835000000 |
| Friday, January 1, 2016 | 1007213000 | 2311000000 |
| Sunday, January 1, 2017 | 1068174000 | 1982500000 |
| Monday, January 1, 2018 | 1269415000 | 2242400000 |
| Tuesday, January 1, 2019 | 1411422000 | 1931200000 |
| Wednesday, January 1, 2020 | 1283159000 | 1831900000 |
| Friday, January 1, 2021 | 1600782000 | 2319200000 |
| Saturday, January 1, 2022 | 1820119000 | 2715500000 |
| Sunday, January 1, 2023 | 2025843000 | 3149900000 |
| Monday, January 1, 2024 | 1779562000 | 3859600000 |
Unlocking the unknown
In the competitive landscape of industrial technology, Trane Technologies plc and AMETEK, Inc. have demonstrated remarkable EBITDA growth over the past decade. From 2014 to 2023, Trane Technologies has consistently outperformed AMETEK, with an average EBITDA of approximately $2.2 billion, compared to AMETEK's $1.4 billion. This represents a 57% higher average EBITDA for Trane Technologies.
This data underscores the resilience and strategic prowess of these industrial giants, with Trane Technologies consistently leading the charge.
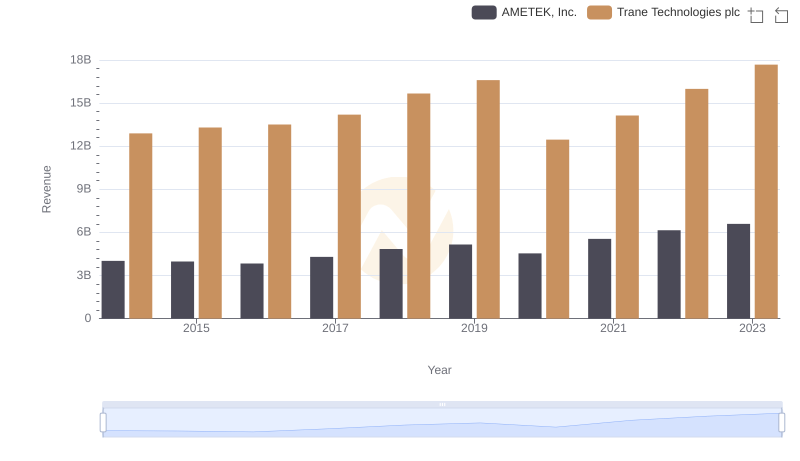
Trane Technologies plc vs AMETEK, Inc.: Annual Revenue Growth Compared
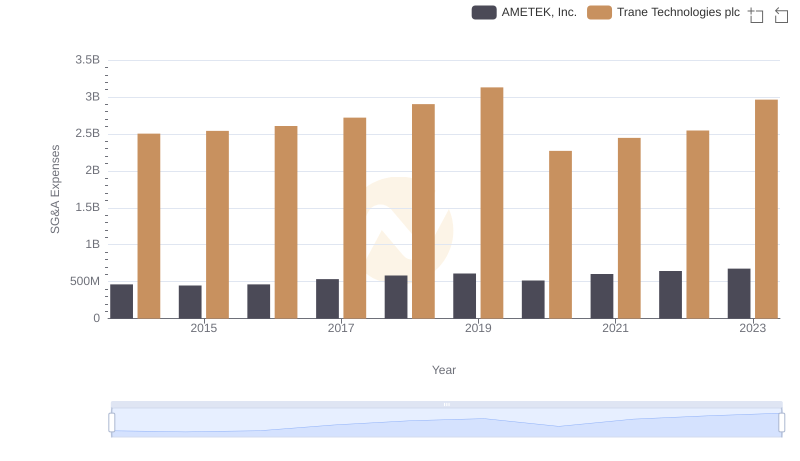
Trane Technologies plc vs AMETEK, Inc.: SG&A Expense Trends
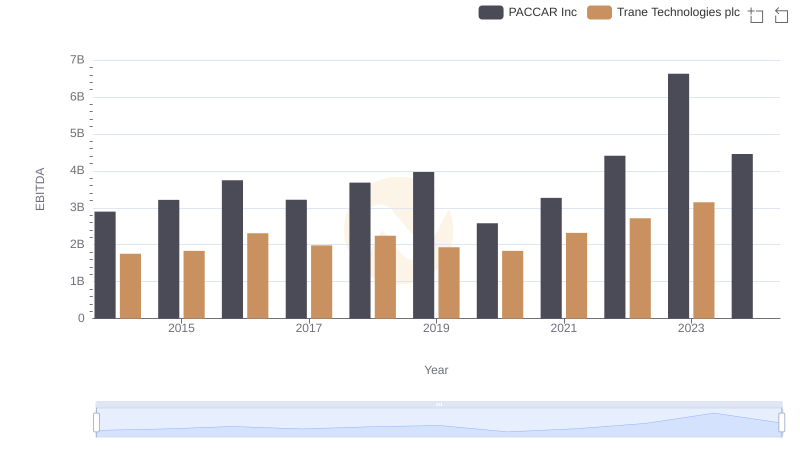
Trane Technologies plc vs PACCAR Inc: In-Depth EBITDA Performance Comparison
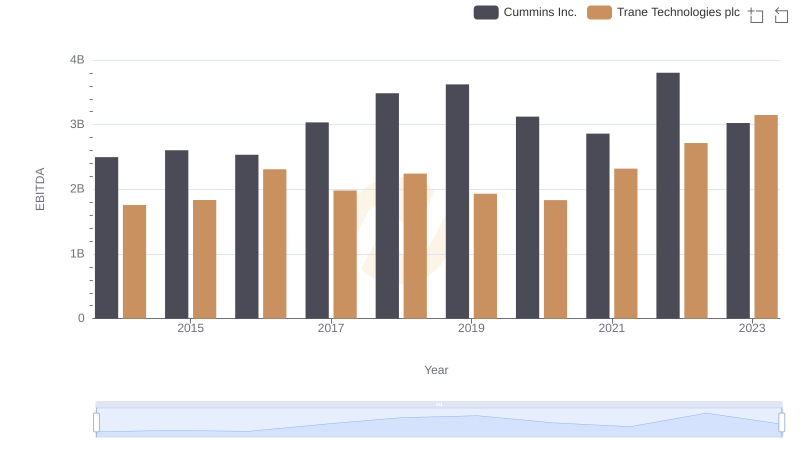
A Side-by-Side Analysis of EBITDA: Trane Technologies plc and Cummins Inc.
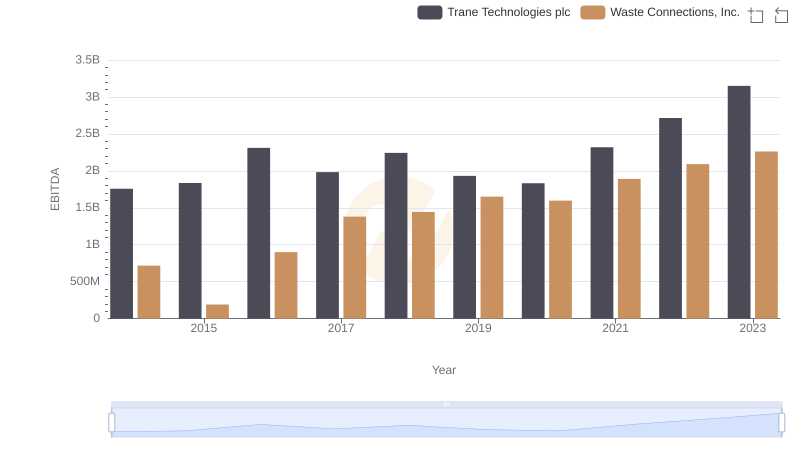
Trane Technologies plc and Waste Connections, Inc.: A Detailed Examination of EBITDA Performance
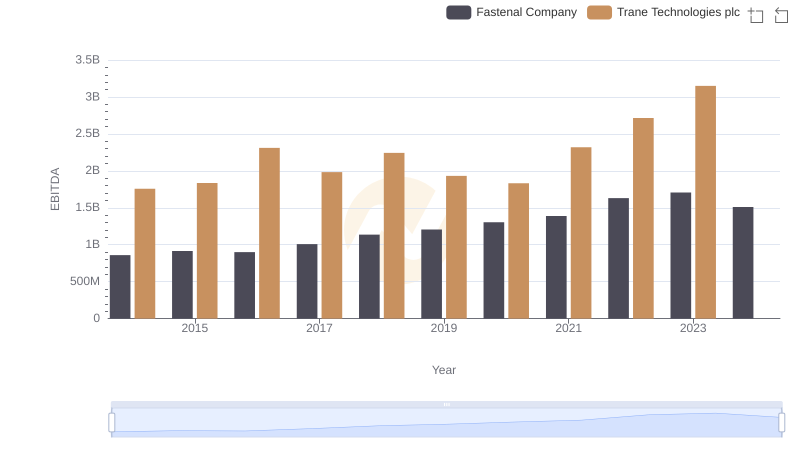
Trane Technologies plc and Fastenal Company: A Detailed Examination of EBITDA Performance
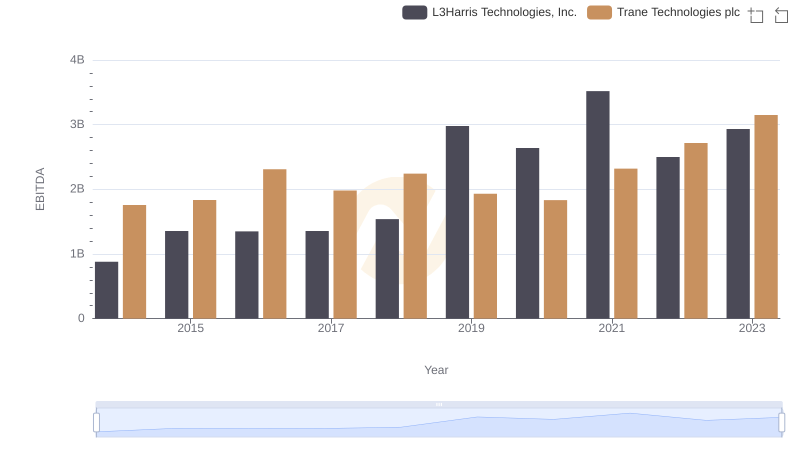
Comparative EBITDA Analysis: Trane Technologies plc vs L3Harris Technologies, Inc.
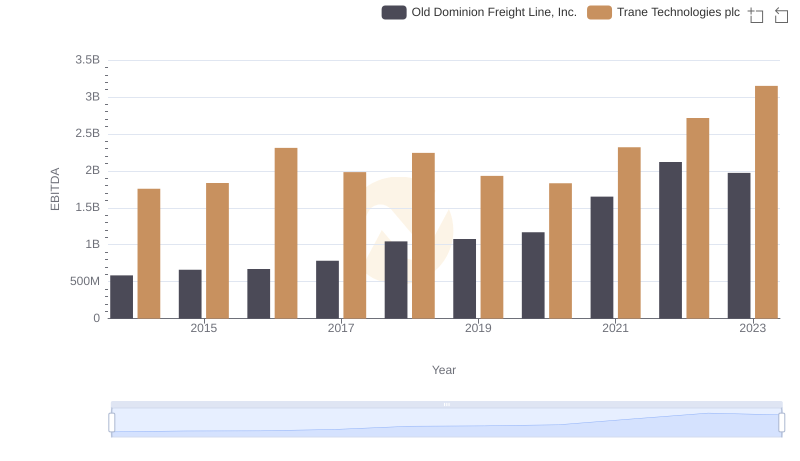
EBITDA Metrics Evaluated: Trane Technologies plc vs Old Dominion Freight Line, Inc.