| __timestamp | Trane Technologies plc | Watsco, Inc. |
|---|---|---|
| Wednesday, January 1, 2014 | 8982800000 | 2988138000 |
| Thursday, January 1, 2015 | 9301600000 | 3105882000 |
| Friday, January 1, 2016 | 9329300000 | 3186118000 |
| Sunday, January 1, 2017 | 9811600000 | 3276296000 |
| Monday, January 1, 2018 | 10847600000 | 3426401000 |
| Tuesday, January 1, 2019 | 11451500000 | 3613406000 |
| Wednesday, January 1, 2020 | 8651300000 | 3832107000 |
| Friday, January 1, 2021 | 9666800000 | 4612647000 |
| Saturday, January 1, 2022 | 11026900000 | 5244055000 |
| Sunday, January 1, 2023 | 11820400000 | 5291627000 |
| Monday, January 1, 2024 | 12757700000 | 5573604000 |
Unlocking the unknown
In the ever-evolving landscape of industrial and commercial services, understanding cost dynamics is crucial. Trane Technologies plc and Watsco, Inc., two giants in the HVAC industry, have shown distinct trends in their cost of revenue over the past decade. From 2014 to 2023, Trane Technologies has seen a steady increase, with costs rising approximately 32%, peaking in 2023. This growth reflects their strategic investments and market expansion. In contrast, Watsco, Inc. experienced a more dramatic rise of about 77% in the same period, indicating aggressive scaling and possibly higher operational costs. Notably, 2020 marked a dip for Trane Technologies, likely due to global disruptions, while Watsco maintained a steady climb. These trends offer valuable insights into the operational strategies and market positioning of these industry leaders, providing a window into their financial health and future trajectories.
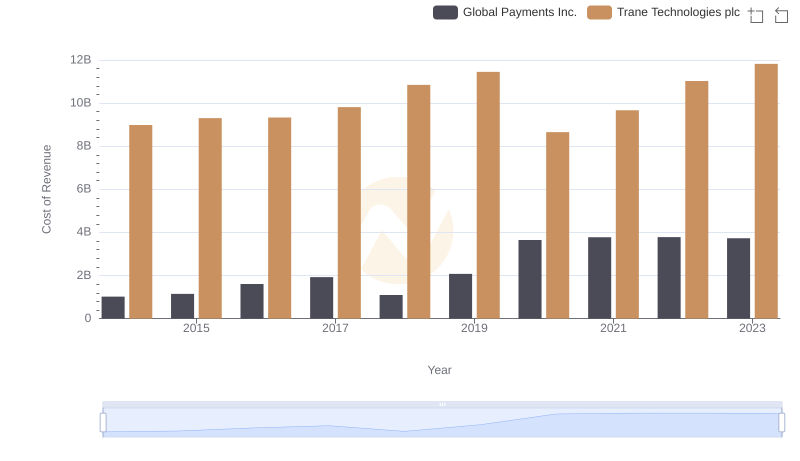
Cost of Revenue Comparison: Trane Technologies plc vs Global Payments Inc.
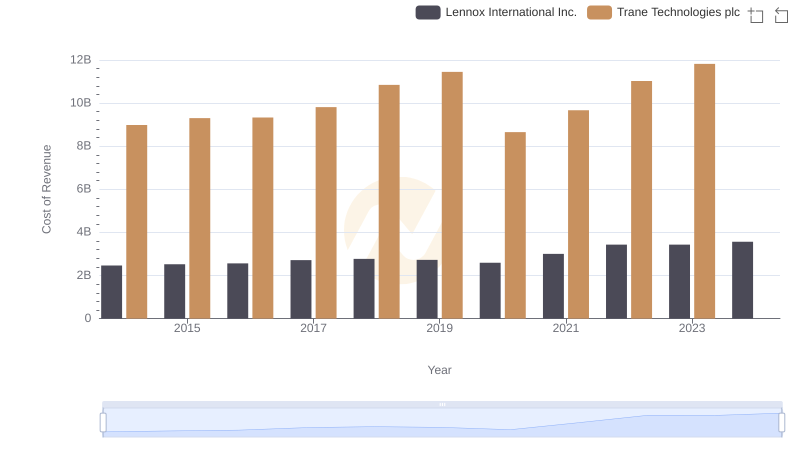
Cost Insights: Breaking Down Trane Technologies plc and Lennox International Inc.'s Expenses
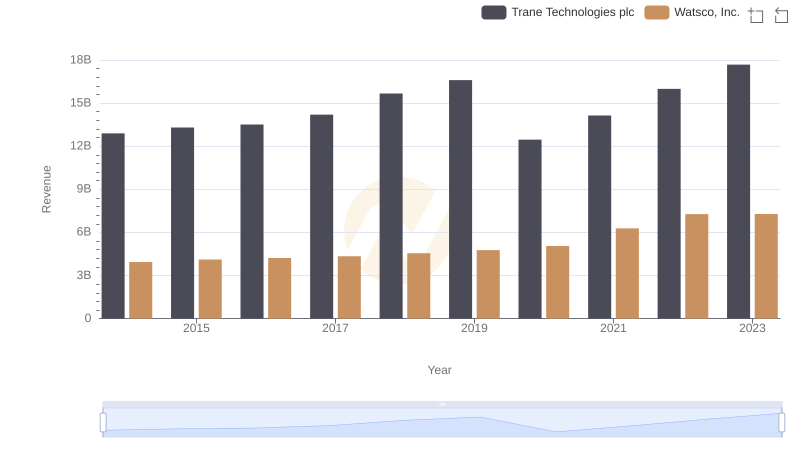
Trane Technologies plc or Watsco, Inc.: Who Leads in Yearly Revenue?
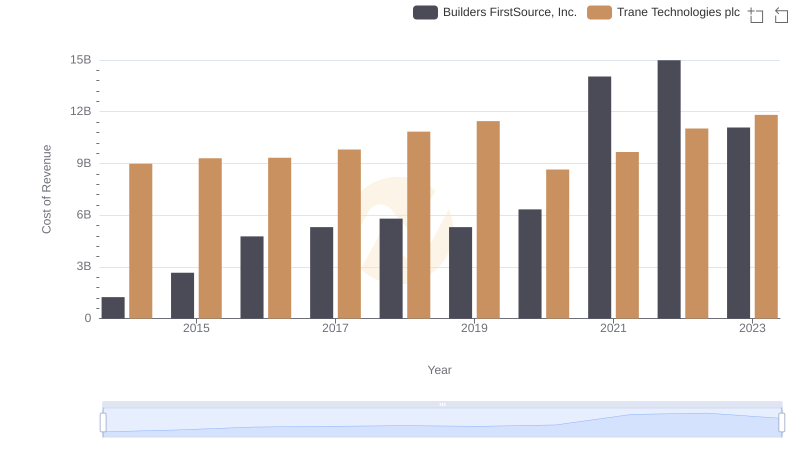
Cost of Revenue: Key Insights for Trane Technologies plc and Builders FirstSource, Inc.
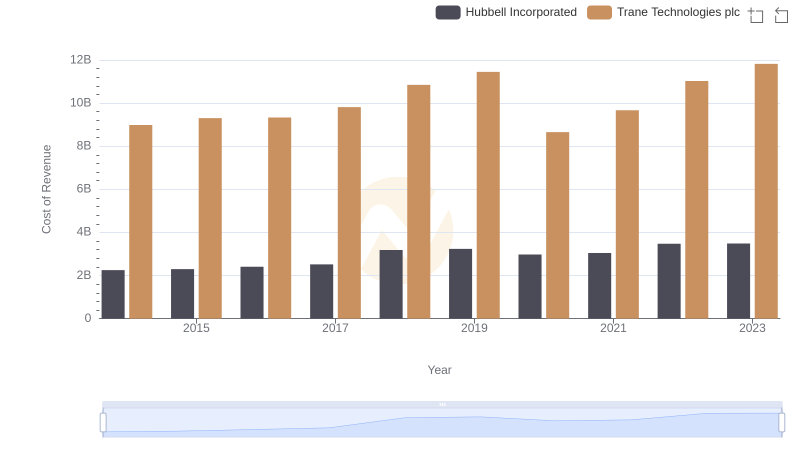
Analyzing Cost of Revenue: Trane Technologies plc and Hubbell Incorporated
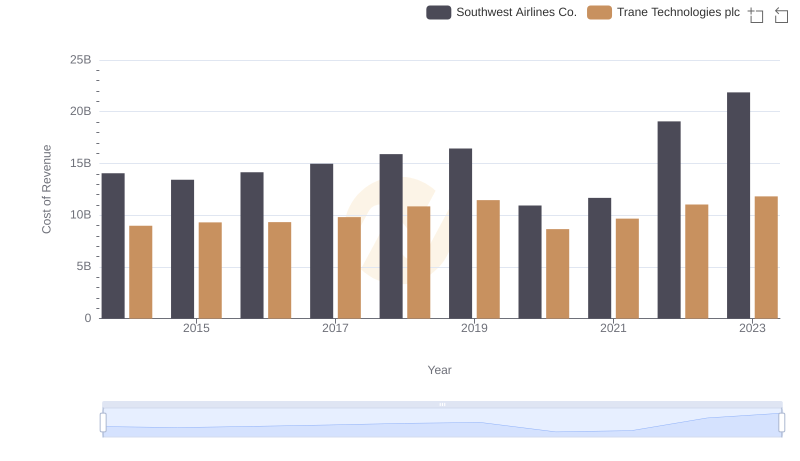
Analyzing Cost of Revenue: Trane Technologies plc and Southwest Airlines Co.
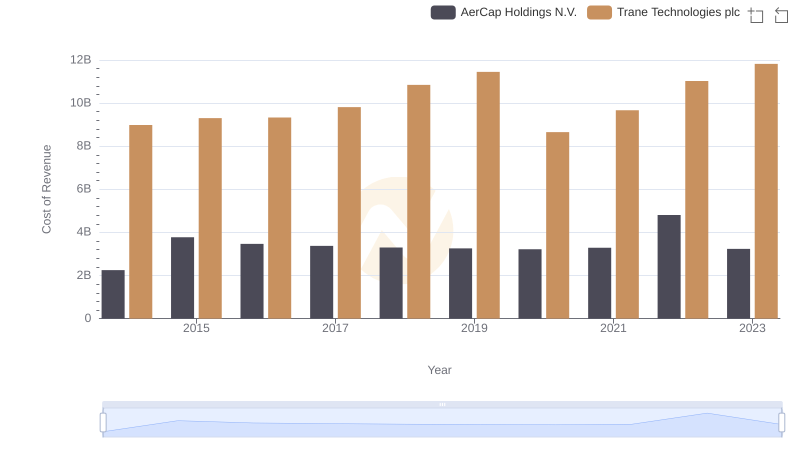
Trane Technologies plc vs AerCap Holdings N.V.: Efficiency in Cost of Revenue Explored
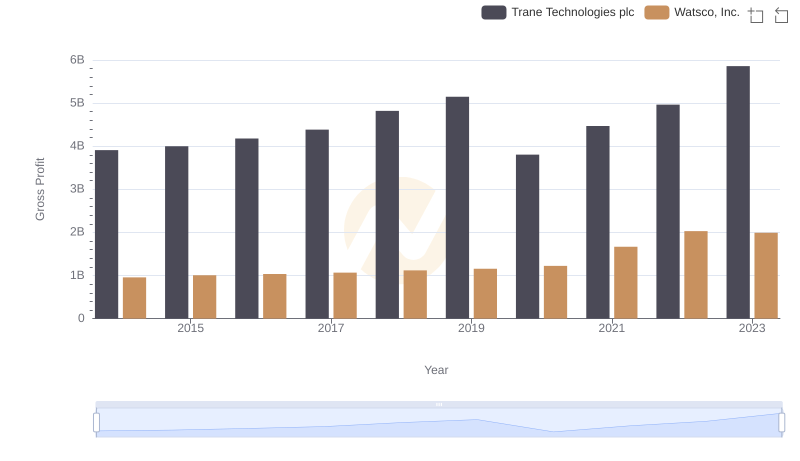
Trane Technologies plc vs Watsco, Inc.: A Gross Profit Performance Breakdown

Cost Management Insights: SG&A Expenses for Trane Technologies plc and Watsco, Inc.
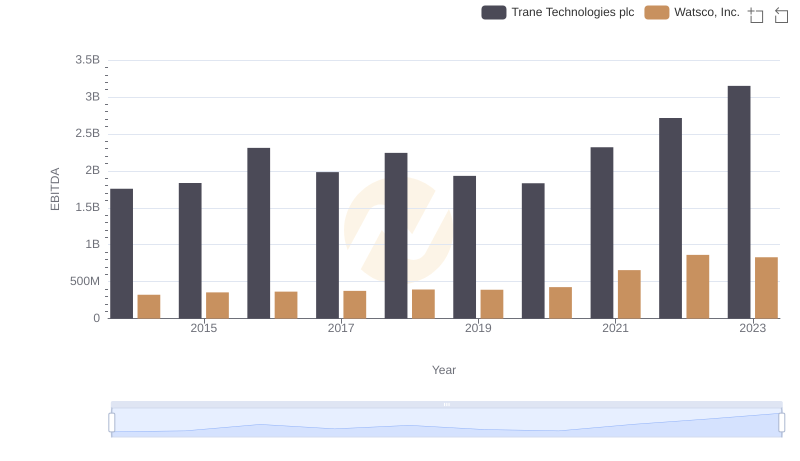
EBITDA Metrics Evaluated: Trane Technologies plc vs Watsco, Inc.