| __timestamp | Global Payments Inc. | Trane Technologies plc |
|---|---|---|
| Wednesday, January 1, 2014 | 594102000 | 1757000000 |
| Thursday, January 1, 2015 | 618109000 | 1835000000 |
| Friday, January 1, 2016 | 748136000 | 2311000000 |
| Sunday, January 1, 2017 | 1010019000 | 1982500000 |
| Monday, January 1, 2018 | 1315968000 | 2242400000 |
| Tuesday, January 1, 2019 | 1764994000 | 1931200000 |
| Wednesday, January 1, 2020 | 2508393000 | 1831900000 |
| Friday, January 1, 2021 | 3233589000 | 2319200000 |
| Saturday, January 1, 2022 | 2427684000 | 2715500000 |
| Sunday, January 1, 2023 | 3606789000 | 3149900000 |
| Monday, January 1, 2024 | 2333605000 | 3859600000 |
Cracking the code
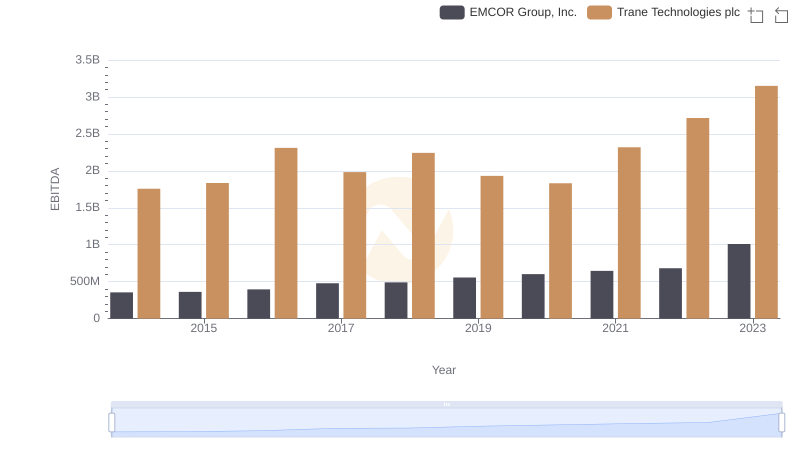
In the ever-evolving landscape of global business, understanding the financial health of companies is crucial. Over the past decade, Trane Technologies plc and Global Payments Inc. have demonstrated remarkable EBITDA growth, reflecting their strategic prowess and market adaptability.
Trane Technologies has shown a consistent upward trajectory in EBITDA, with a notable 79% increase from 2014 to 2023. This growth underscores the company's commitment to innovation and sustainability in the climate solutions sector.
Global Payments Inc. has experienced a staggering 529% rise in EBITDA over the same period, highlighting its aggressive expansion and adaptation in the digital payments industry.
While both companies have thrived, Global Payments' EBITDA growth outpaces Trane Technologies, reflecting the rapid digital transformation in financial services. This comparative analysis offers a glimpse into the strategic directions and market conditions shaping these industry leaders.
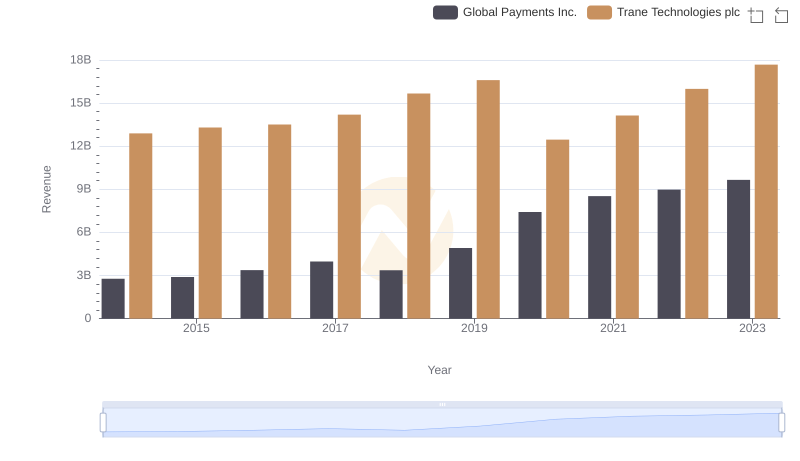
Trane Technologies plc and Global Payments Inc.: A Comprehensive Revenue Analysis
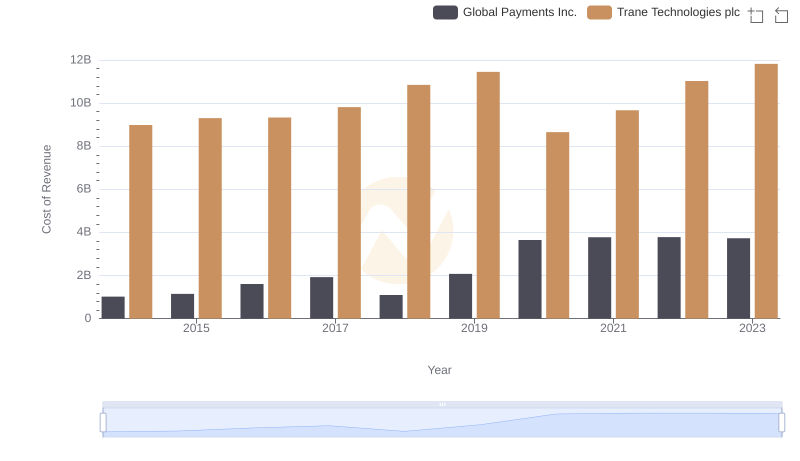
Cost of Revenue Comparison: Trane Technologies plc vs Global Payments Inc.
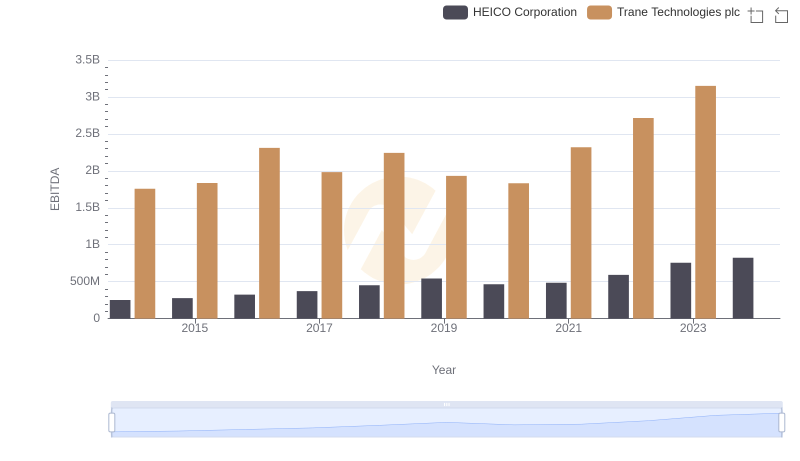
A Professional Review of EBITDA: Trane Technologies plc Compared to HEICO Corporation
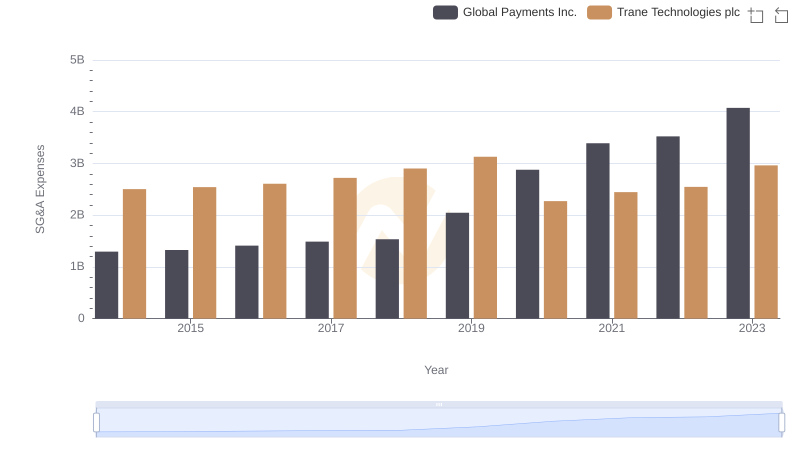
Breaking Down SG&A Expenses: Trane Technologies plc vs Global Payments Inc.
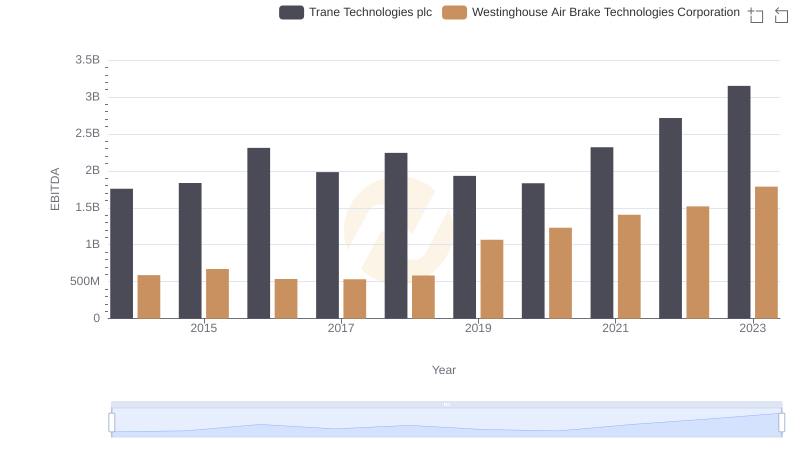
EBITDA Analysis: Evaluating Trane Technologies plc Against Westinghouse Air Brake Technologies Corporation
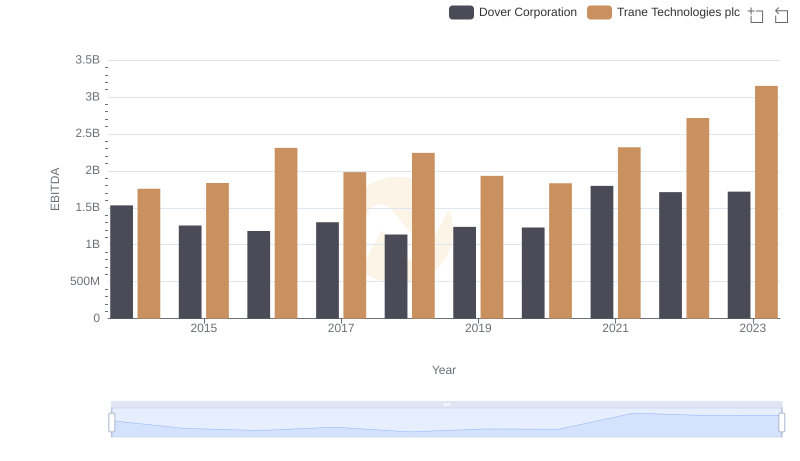
A Side-by-Side Analysis of EBITDA: Trane Technologies plc and Dover Corporation
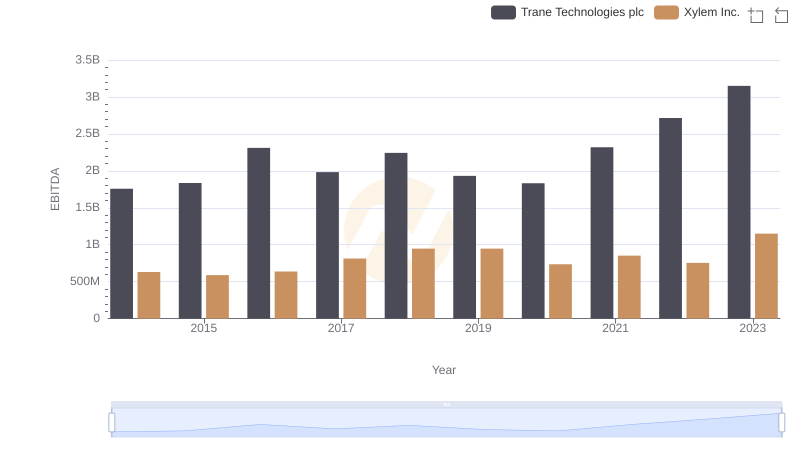
A Professional Review of EBITDA: Trane Technologies plc Compared to Xylem Inc.
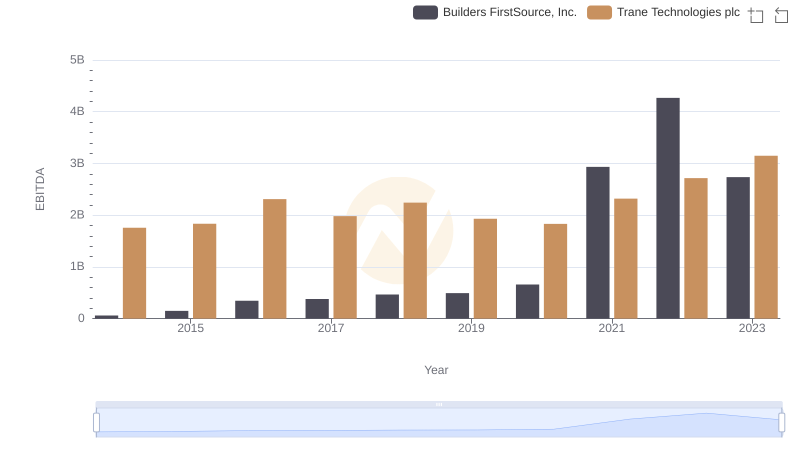
EBITDA Metrics Evaluated: Trane Technologies plc vs Builders FirstSource, Inc.
A Professional Review of EBITDA: Trane Technologies plc Compared to EMCOR Group, Inc.