| __timestamp | Global Payments Inc. | Trane Technologies plc |
|---|---|---|
| Wednesday, January 1, 2014 | 1022107000 | 8982800000 |
| Thursday, January 1, 2015 | 1147639000 | 9301600000 |
| Friday, January 1, 2016 | 1603532000 | 9329300000 |
| Sunday, January 1, 2017 | 1928037000 | 9811600000 |
| Monday, January 1, 2018 | 1095014000 | 10847600000 |
| Tuesday, January 1, 2019 | 2073803000 | 11451500000 |
| Wednesday, January 1, 2020 | 3650727000 | 8651300000 |
| Friday, January 1, 2021 | 3773725000 | 9666800000 |
| Saturday, January 1, 2022 | 3778617000 | 11026900000 |
| Sunday, January 1, 2023 | 3727521000 | 11820400000 |
| Monday, January 1, 2024 | 3760116000 | 12757700000 |
Igniting the spark of knowledge
In the ever-evolving landscape of global business, understanding the cost of revenue is crucial for evaluating a company's efficiency and profitability. Trane Technologies plc and Global Payments Inc. offer a fascinating comparison in this regard. Over the past decade, Trane Technologies has consistently maintained a higher cost of revenue, peaking at approximately $11.8 billion in 2023. This represents a steady increase of around 32% from 2014. In contrast, Global Payments Inc. has seen a more volatile trajectory, with its cost of revenue rising by nearly 265% from 2014 to 2023, reaching about $3.7 billion. This stark difference highlights the diverse operational strategies and market dynamics faced by these industry leaders. As we delve deeper into these figures, it becomes evident that while Trane Technologies focuses on steady growth, Global Payments Inc. navigates a more fluctuating financial landscape.
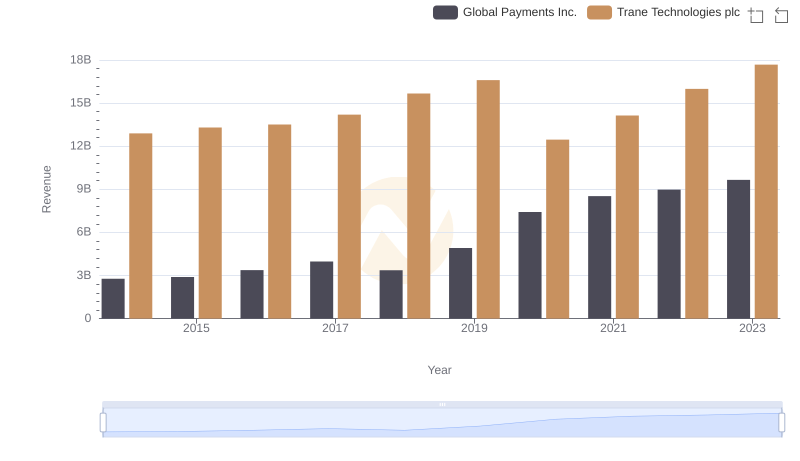
Trane Technologies plc and Global Payments Inc.: A Comprehensive Revenue Analysis
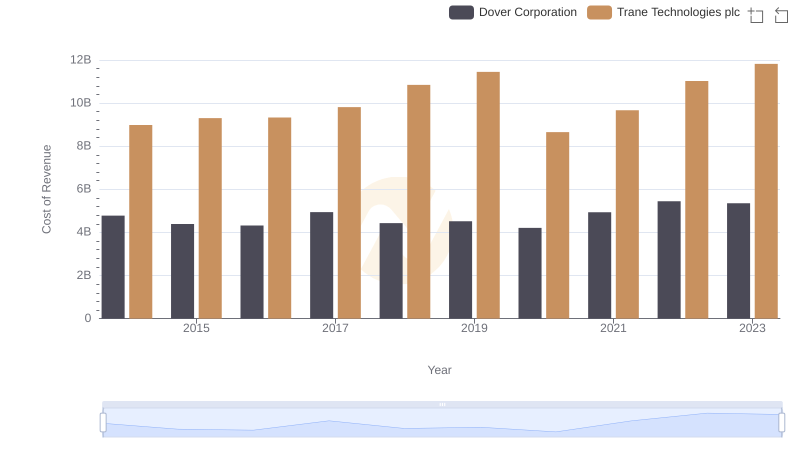
Cost of Revenue: Key Insights for Trane Technologies plc and Dover Corporation
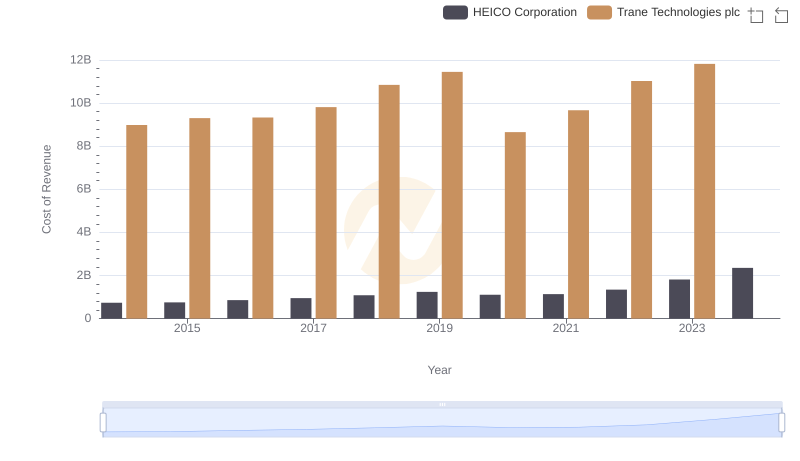
Cost Insights: Breaking Down Trane Technologies plc and HEICO Corporation's Expenses
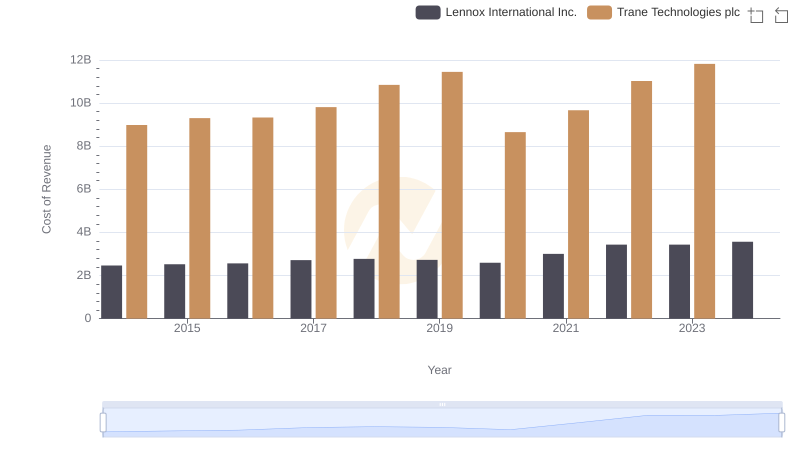
Cost Insights: Breaking Down Trane Technologies plc and Lennox International Inc.'s Expenses
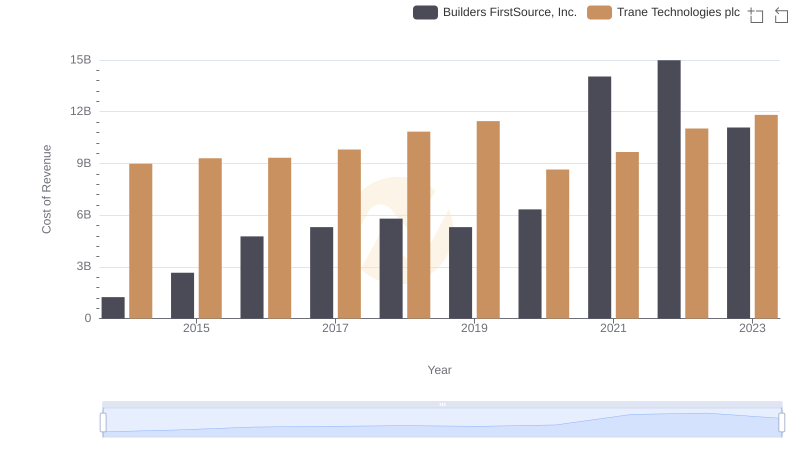
Cost of Revenue: Key Insights for Trane Technologies plc and Builders FirstSource, Inc.
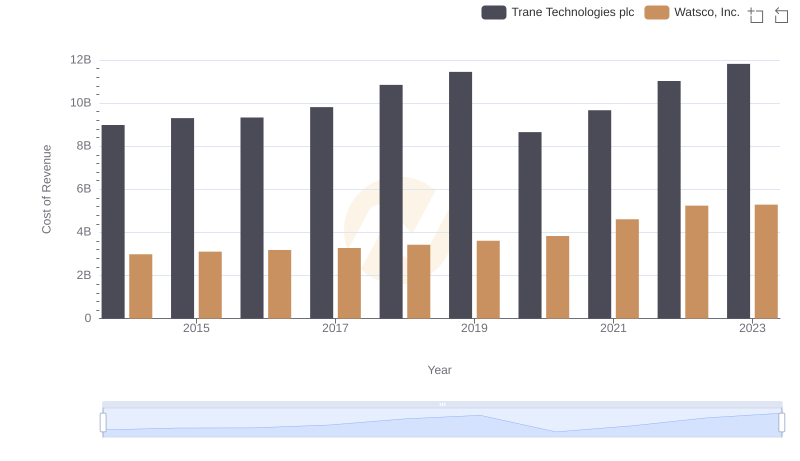
Cost of Revenue Trends: Trane Technologies plc vs Watsco, Inc.
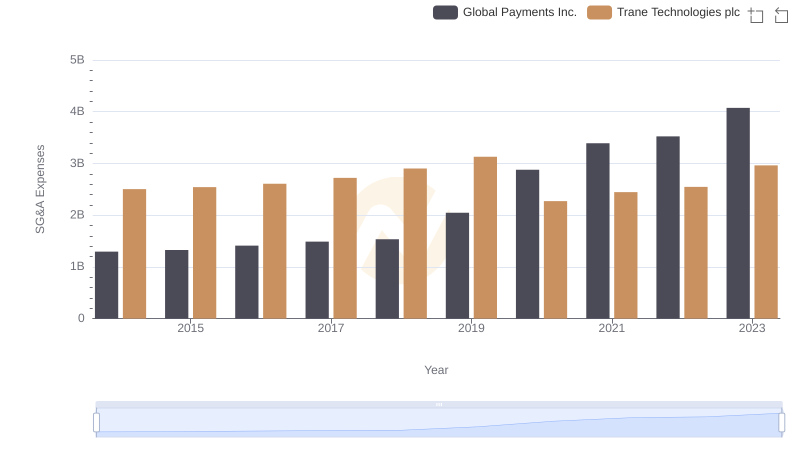
Breaking Down SG&A Expenses: Trane Technologies plc vs Global Payments Inc.
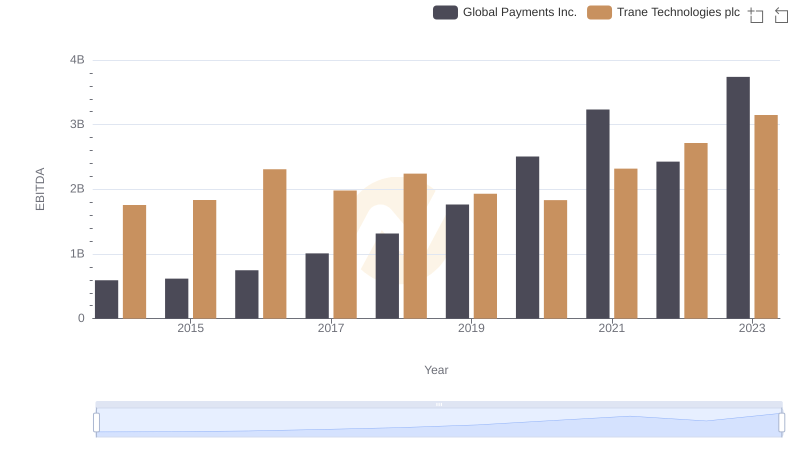
Comparative EBITDA Analysis: Trane Technologies plc vs Global Payments Inc.