| __timestamp | Global Payments Inc. | Trane Technologies plc |
|---|---|---|
| Wednesday, January 1, 2014 | 1295014000 | 2503900000 |
| Thursday, January 1, 2015 | 1325567000 | 2541100000 |
| Friday, January 1, 2016 | 1411096000 | 2606500000 |
| Sunday, January 1, 2017 | 1488258000 | 2720700000 |
| Monday, January 1, 2018 | 1534297000 | 2903200000 |
| Tuesday, January 1, 2019 | 2046672000 | 3129800000 |
| Wednesday, January 1, 2020 | 2878878000 | 2270600000 |
| Friday, January 1, 2021 | 3391161000 | 2446300000 |
| Saturday, January 1, 2022 | 3524578000 | 2545900000 |
| Sunday, January 1, 2023 | 4073768000 | 2963200000 |
| Monday, January 1, 2024 | 4285307000 | 3580400000 |
Cracking the code
In the ever-evolving landscape of corporate finance, understanding the nuances of Selling, General, and Administrative (SG&A) expenses is crucial. Over the past decade, Trane Technologies plc and Global Payments Inc. have showcased distinct trajectories in their SG&A expenditures. From 2014 to 2023, Global Payments Inc. saw a staggering 214% increase in SG&A expenses, peaking in 2023. In contrast, Trane Technologies plc experienced a more modest 18% rise, with a notable dip in 2020. This divergence highlights differing strategic priorities and operational efficiencies. While Global Payments Inc. ramped up its spending, possibly to fuel growth and expansion, Trane Technologies maintained a steadier course, reflecting perhaps a focus on cost control. This analysis underscores the importance of SG&A management in shaping a company's financial health and competitive edge.
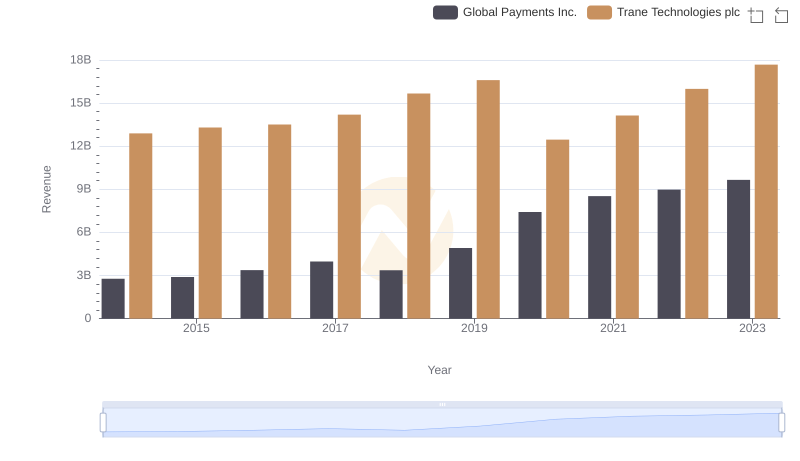
Trane Technologies plc and Global Payments Inc.: A Comprehensive Revenue Analysis
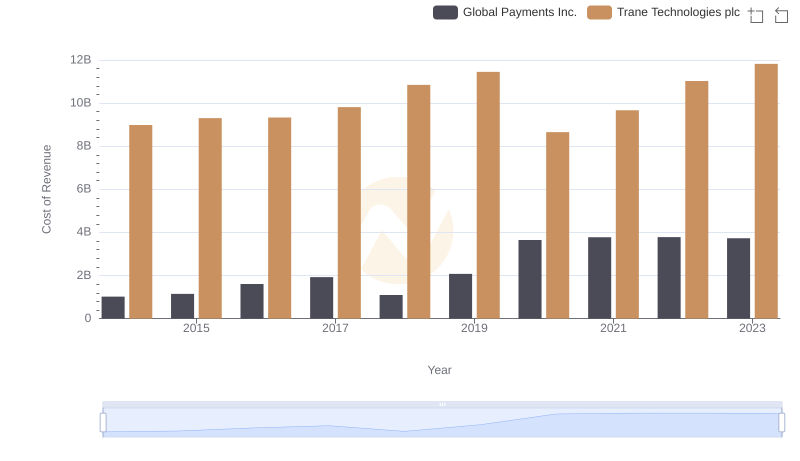
Cost of Revenue Comparison: Trane Technologies plc vs Global Payments Inc.
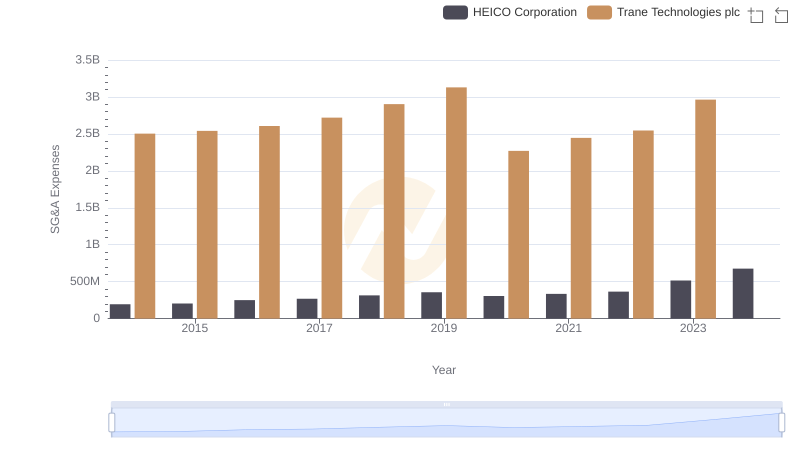
Trane Technologies plc or HEICO Corporation: Who Manages SG&A Costs Better?
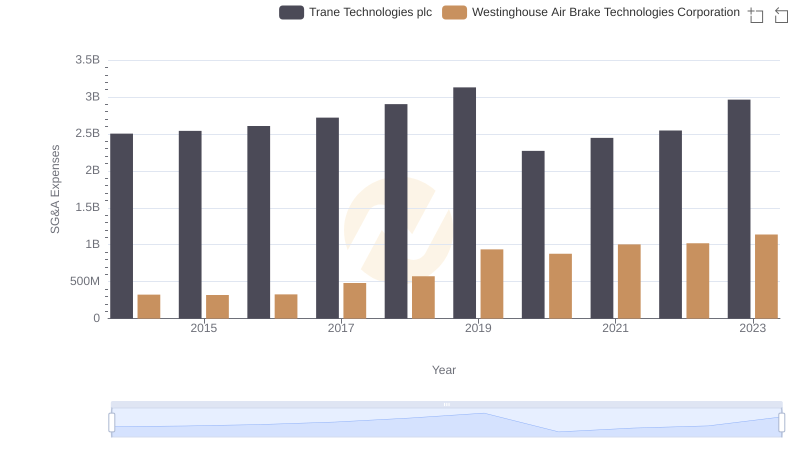
Trane Technologies plc and Westinghouse Air Brake Technologies Corporation: SG&A Spending Patterns Compared

Trane Technologies plc and Xylem Inc.: SG&A Spending Patterns Compared
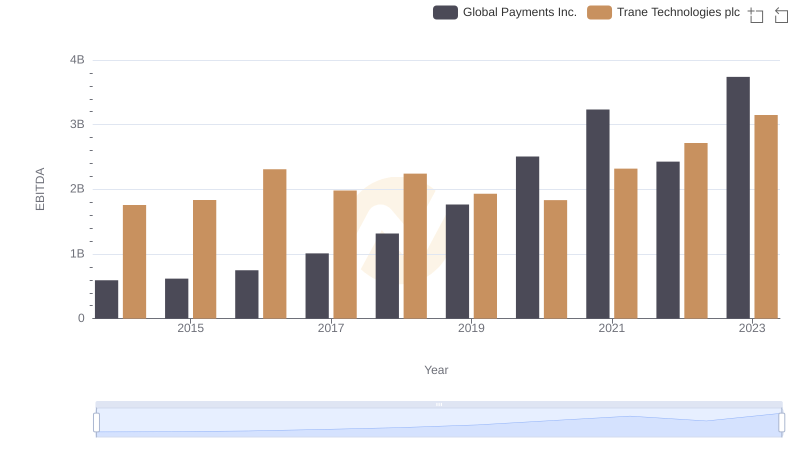
Comparative EBITDA Analysis: Trane Technologies plc vs Global Payments Inc.
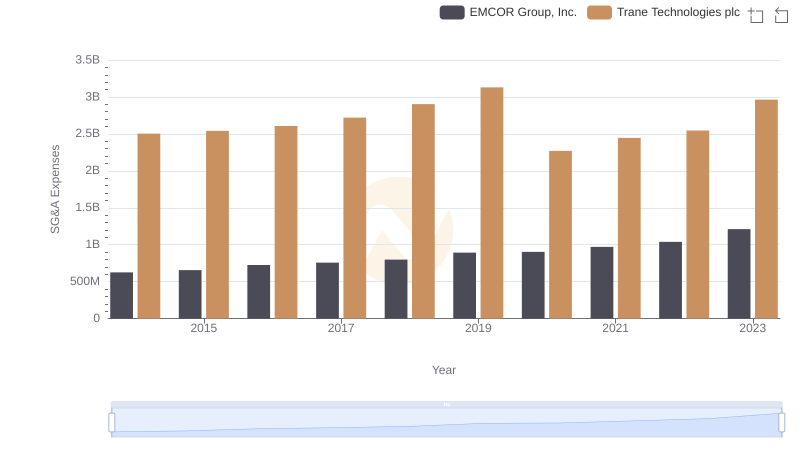
Trane Technologies plc vs EMCOR Group, Inc.: SG&A Expense Trends
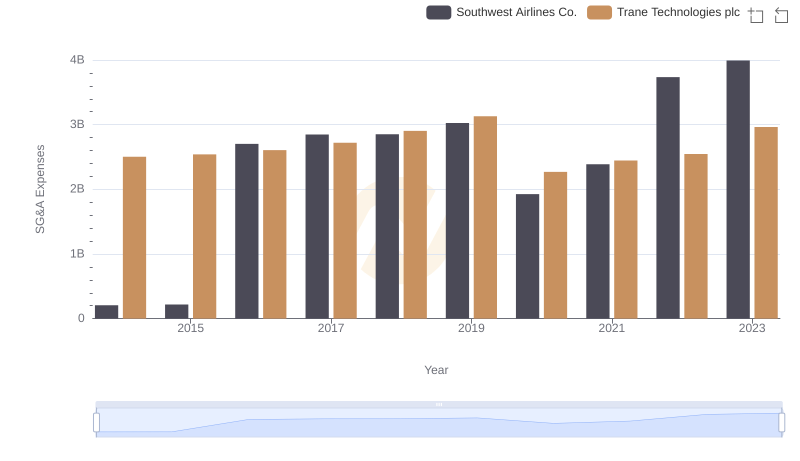
Operational Costs Compared: SG&A Analysis of Trane Technologies plc and Southwest Airlines Co.

Cost Management Insights: SG&A Expenses for Trane Technologies plc and Builders FirstSource, Inc.
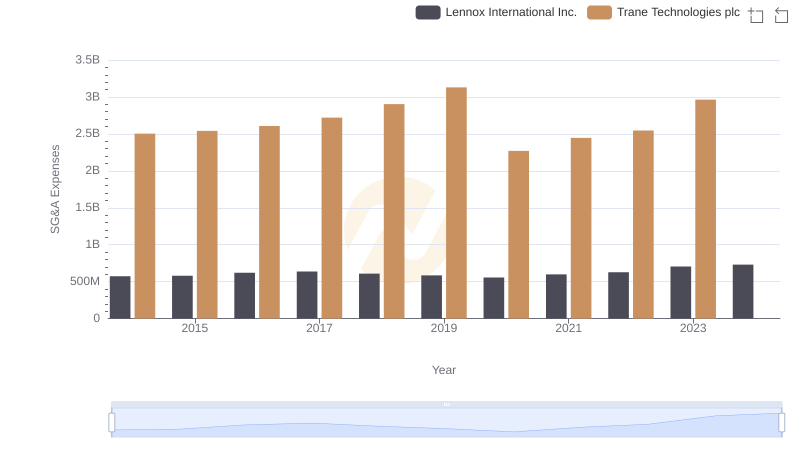
Selling, General, and Administrative Costs: Trane Technologies plc vs Lennox International Inc.