| __timestamp | Pool Corporation | United Airlines Holdings, Inc. |
|---|---|---|
| Wednesday, January 1, 2014 | 2246562000 | 38901000000 |
| Thursday, January 1, 2015 | 2363139000 | 37864000000 |
| Friday, January 1, 2016 | 2570803000 | 36556000000 |
| Sunday, January 1, 2017 | 2788188000 | 37736000000 |
| Monday, January 1, 2018 | 2998097000 | 41303000000 |
| Tuesday, January 1, 2019 | 3199517000 | 43259000000 |
| Wednesday, January 1, 2020 | 3936623000 | 15355000000 |
| Friday, January 1, 2021 | 5295584000 | 24634000000 |
| Saturday, January 1, 2022 | 6179727000 | 44955000000 |
| Sunday, January 1, 2023 | 5541595000 | 53717000000 |
| Monday, January 1, 2024 | 57063000000 |
Unleashing the power of data
In the ever-evolving landscape of American business, the revenue trajectories of United Airlines Holdings, Inc. and Pool Corporation offer a fascinating glimpse into the resilience and adaptability of two distinct industries. From 2014 to 2023, United Airlines consistently outpaced Pool Corporation, with revenues peaking at approximately $53.7 billion in 2023, a remarkable recovery from the pandemic-induced dip in 2020. This represents a staggering 250% increase from their lowest point in 2020.
Meanwhile, Pool Corporation, a leader in the leisure and outdoor living sector, demonstrated steady growth, achieving a 145% increase in revenue over the same period, culminating in a peak of $6.18 billion in 2022. This growth underscores the rising demand for home-based leisure activities. As we look to the future, these trends highlight the dynamic nature of consumer preferences and the strategic pivots companies must make to thrive.
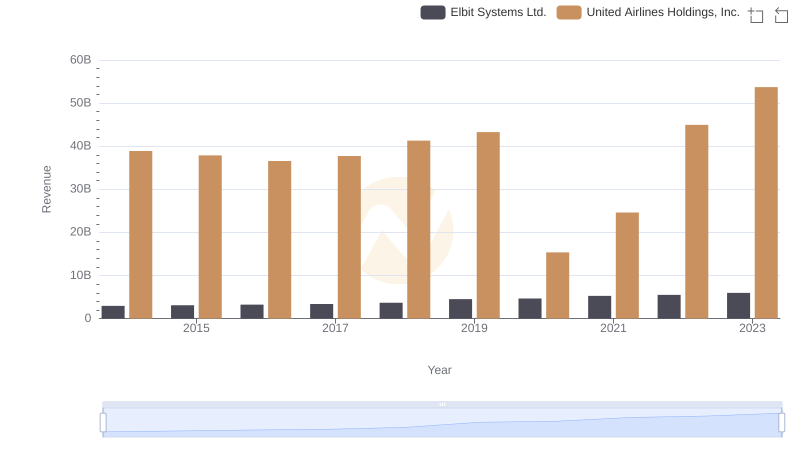
United Airlines Holdings, Inc. vs Elbit Systems Ltd.: Examining Key Revenue Metrics
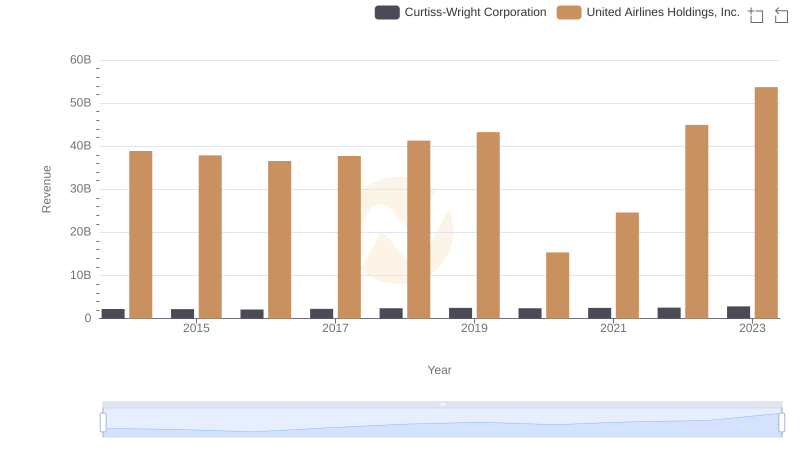
United Airlines Holdings, Inc. vs Curtiss-Wright Corporation: Annual Revenue Growth Compared
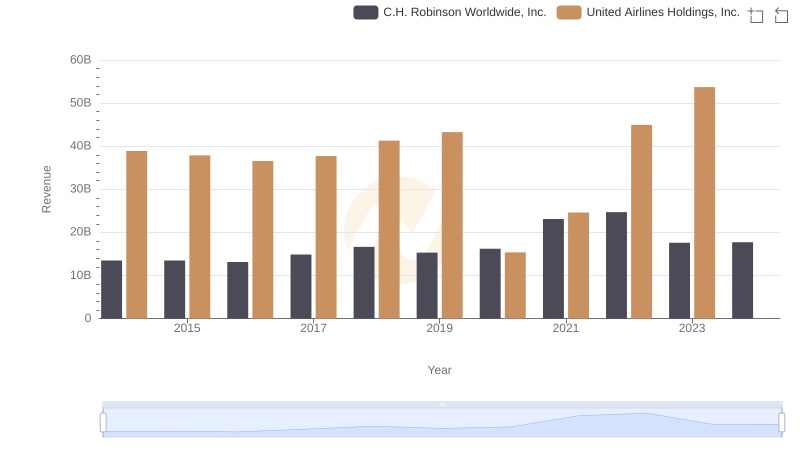
Comparing Revenue Performance: United Airlines Holdings, Inc. or C.H. Robinson Worldwide, Inc.?
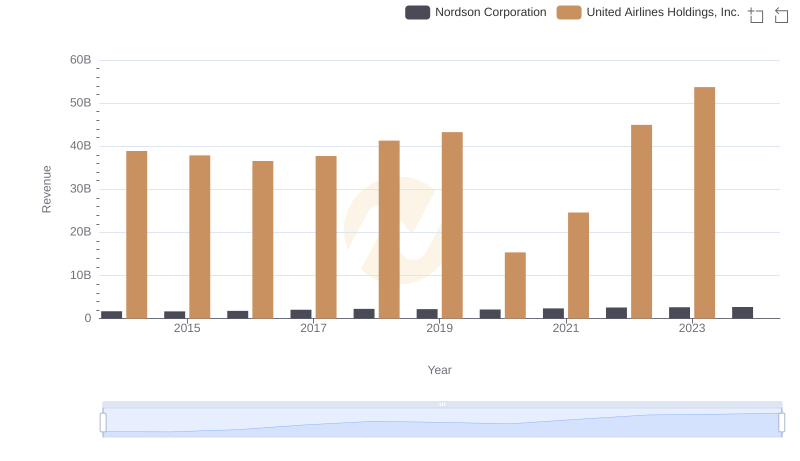
Revenue Insights: United Airlines Holdings, Inc. and Nordson Corporation Performance Compared
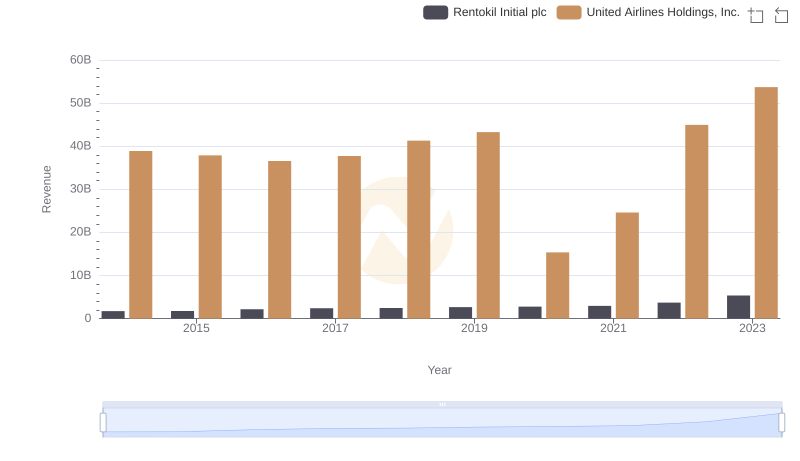
Who Generates More Revenue? United Airlines Holdings, Inc. or Rentokil Initial plc
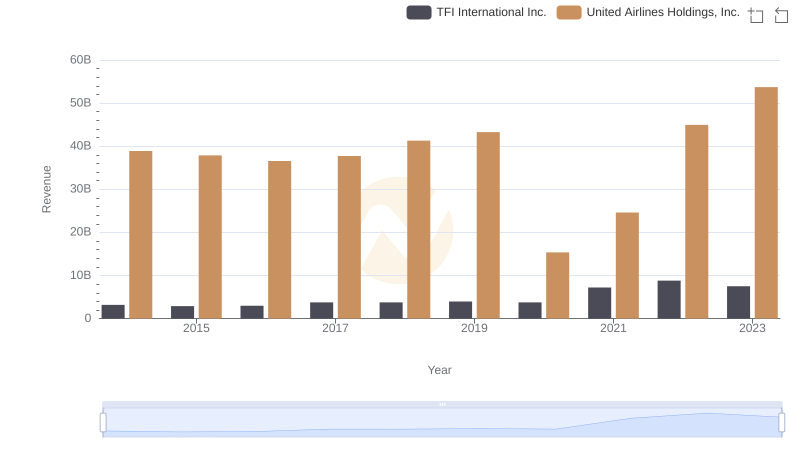
Who Generates More Revenue? United Airlines Holdings, Inc. or TFI International Inc.
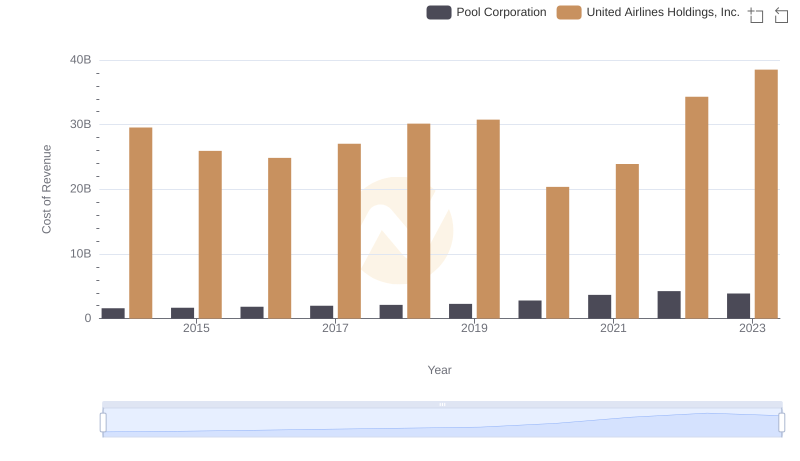
Cost Insights: Breaking Down United Airlines Holdings, Inc. and Pool Corporation's Expenses
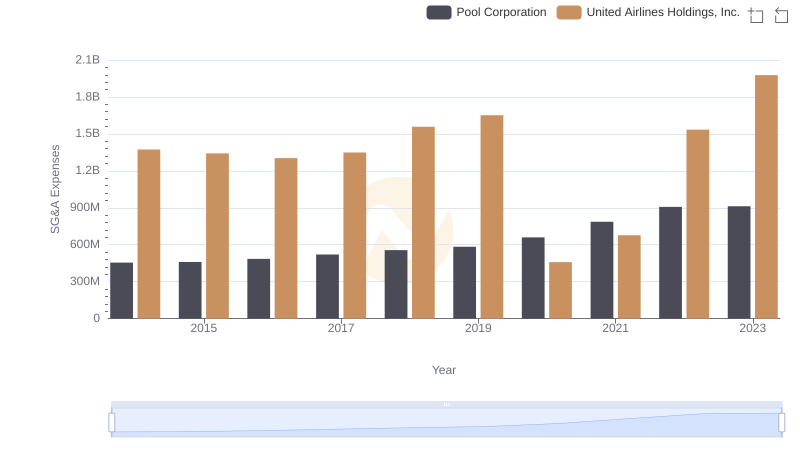
SG&A Efficiency Analysis: Comparing United Airlines Holdings, Inc. and Pool Corporation