| __timestamp | EMCOR Group, Inc. | Trane Technologies plc |
|---|---|---|
| Wednesday, January 1, 2014 | 626478000 | 2503900000 |
| Thursday, January 1, 2015 | 656573000 | 2541100000 |
| Friday, January 1, 2016 | 725538000 | 2606500000 |
| Sunday, January 1, 2017 | 757062000 | 2720700000 |
| Monday, January 1, 2018 | 799157000 | 2903200000 |
| Tuesday, January 1, 2019 | 893453000 | 3129800000 |
| Wednesday, January 1, 2020 | 903584000 | 2270600000 |
| Friday, January 1, 2021 | 970937000 | 2446300000 |
| Saturday, January 1, 2022 | 1038717000 | 2545900000 |
| Sunday, January 1, 2023 | 1211233000 | 2963200000 |
| Monday, January 1, 2024 | 3580400000 |
Unveiling the hidden dimensions of data
In the ever-evolving landscape of corporate finance, understanding the trends in Selling, General, and Administrative (SG&A) expenses is crucial for investors and analysts alike. Over the past decade, Trane Technologies plc and EMCOR Group, Inc. have showcased distinct trajectories in their SG&A expenditures.
From 2014 to 2023, Trane Technologies consistently maintained higher SG&A expenses compared to EMCOR Group. Notably, Trane's expenses peaked in 2019, reaching nearly 3.13 billion, before experiencing a dip in 2020. This dip coincided with the global economic disruptions caused by the pandemic, highlighting the company's adaptive strategies.
Conversely, EMCOR Group demonstrated a steady increase in SG&A expenses, culminating in a 93% rise from 2014 to 2023. This growth reflects EMCOR's expanding operations and strategic investments.
These trends underscore the dynamic nature of corporate financial management and offer valuable insights for stakeholders aiming to navigate the complexities of the market.
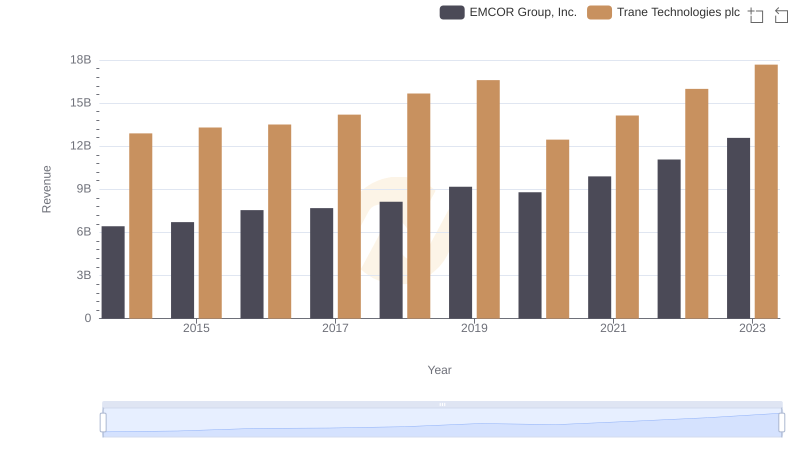
Trane Technologies plc and EMCOR Group, Inc.: A Comprehensive Revenue Analysis
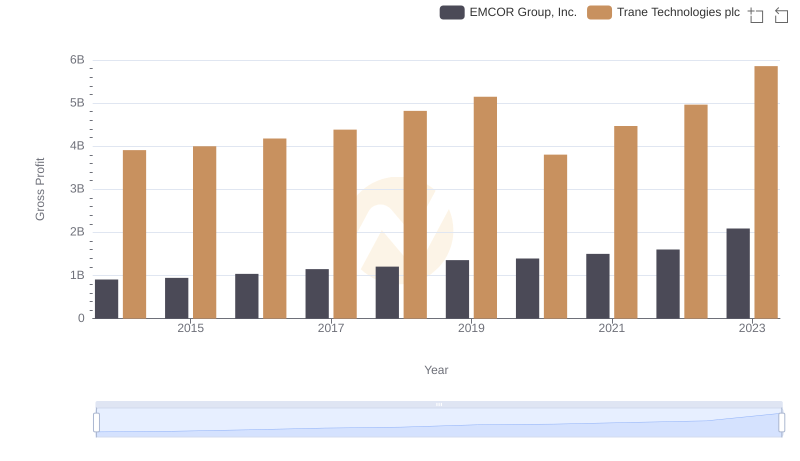
Gross Profit Trends Compared: Trane Technologies plc vs EMCOR Group, Inc.
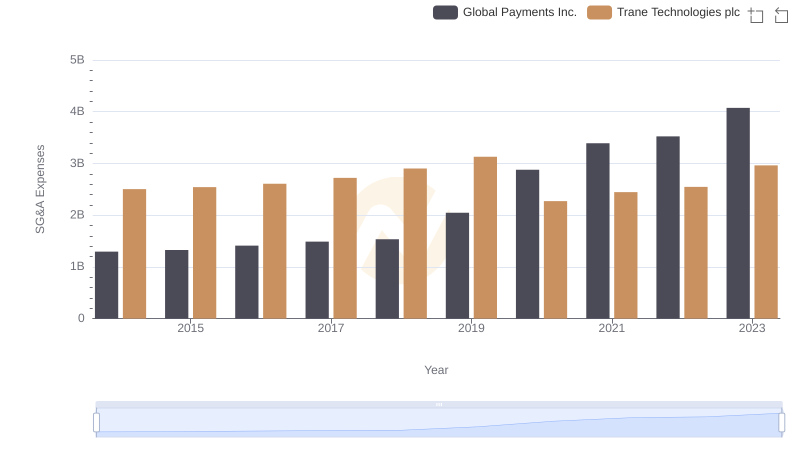
Breaking Down SG&A Expenses: Trane Technologies plc vs Global Payments Inc.

Trane Technologies plc and Xylem Inc.: SG&A Spending Patterns Compared
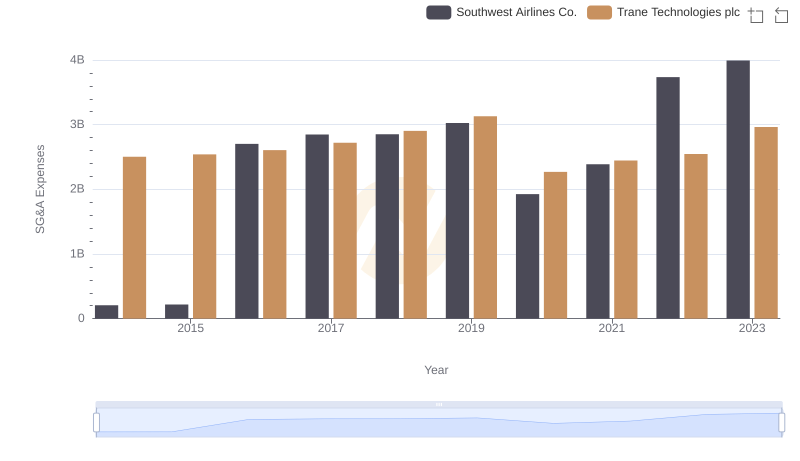
Operational Costs Compared: SG&A Analysis of Trane Technologies plc and Southwest Airlines Co.

Cost Management Insights: SG&A Expenses for Trane Technologies plc and Builders FirstSource, Inc.
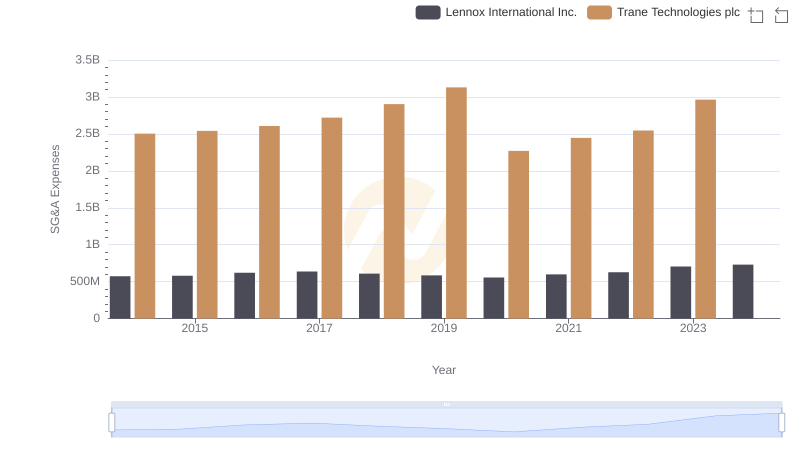
Selling, General, and Administrative Costs: Trane Technologies plc vs Lennox International Inc.
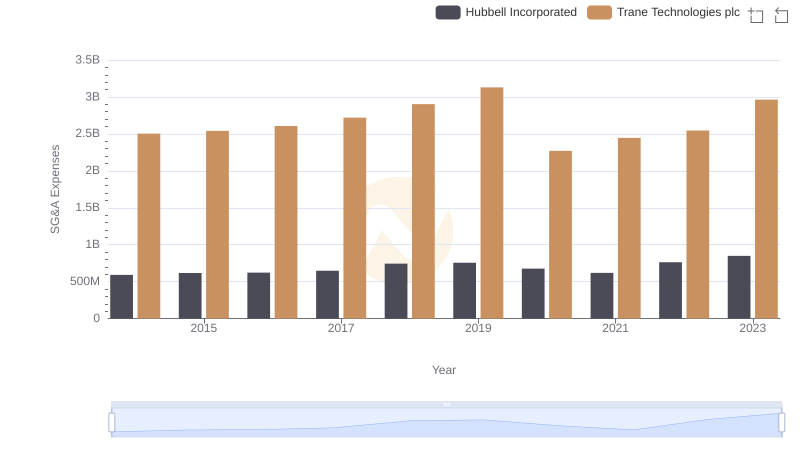
SG&A Efficiency Analysis: Comparing Trane Technologies plc and Hubbell Incorporated
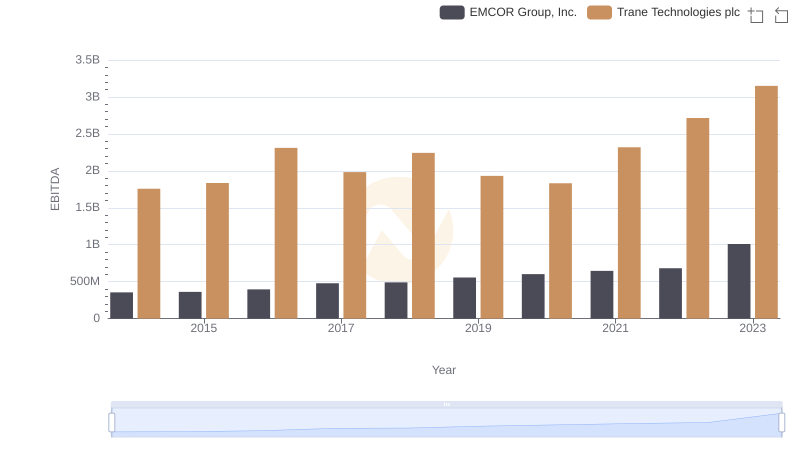
A Professional Review of EBITDA: Trane Technologies plc Compared to EMCOR Group, Inc.

Cost Management Insights: SG&A Expenses for Trane Technologies plc and Watsco, Inc.