| __timestamp | Trane Technologies plc | Xylem Inc. |
|---|---|---|
| Wednesday, January 1, 2014 | 2503900000 | 920000000 |
| Thursday, January 1, 2015 | 2541100000 | 854000000 |
| Friday, January 1, 2016 | 2606500000 | 915000000 |
| Sunday, January 1, 2017 | 2720700000 | 1090000000 |
| Monday, January 1, 2018 | 2903200000 | 1161000000 |
| Tuesday, January 1, 2019 | 3129800000 | 1158000000 |
| Wednesday, January 1, 2020 | 2270600000 | 1143000000 |
| Friday, January 1, 2021 | 2446300000 | 1179000000 |
| Saturday, January 1, 2022 | 2545900000 | 1227000000 |
| Sunday, January 1, 2023 | 2963200000 | 1757000000 |
| Monday, January 1, 2024 | 3580400000 |
Unlocking the unknown
In the ever-evolving landscape of industrial innovation, understanding the financial strategies of key players is crucial. Trane Technologies plc and Xylem Inc., two giants in their respective fields, have shown distinct patterns in their Selling, General, and Administrative (SG&A) expenses over the past decade. From 2014 to 2023, Trane Technologies consistently outspent Xylem, with SG&A expenses peaking at nearly 3 billion in 2019, a 25% increase from 2014. Meanwhile, Xylem's SG&A expenses grew by approximately 91% during the same period, reaching their highest in 2023. This divergence highlights Trane's aggressive investment in administrative capabilities, while Xylem's steady growth reflects a more conservative approach. These trends offer a window into each company's strategic priorities and market positioning, providing valuable insights for investors and industry analysts alike.
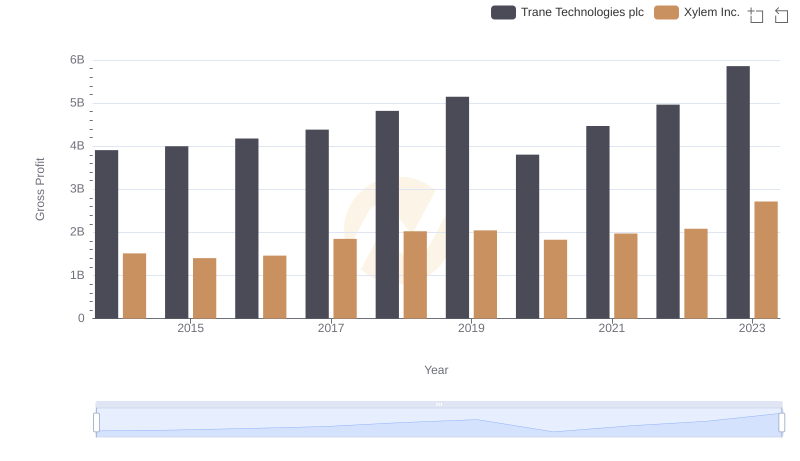
Trane Technologies plc vs Xylem Inc.: A Gross Profit Performance Breakdown
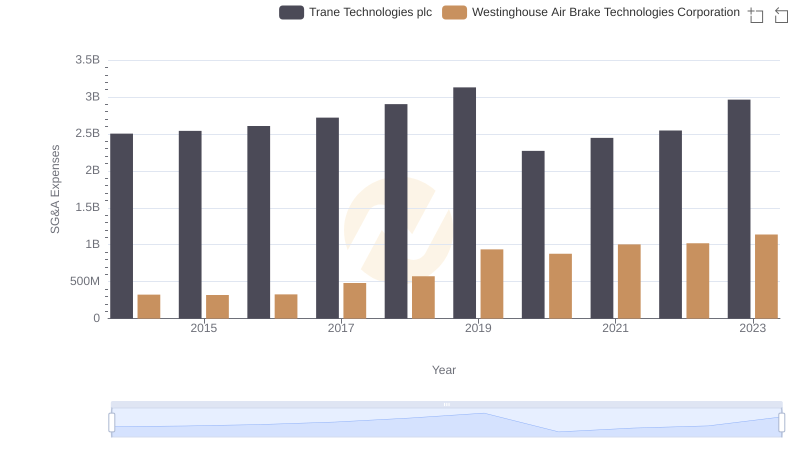
Trane Technologies plc and Westinghouse Air Brake Technologies Corporation: SG&A Spending Patterns Compared
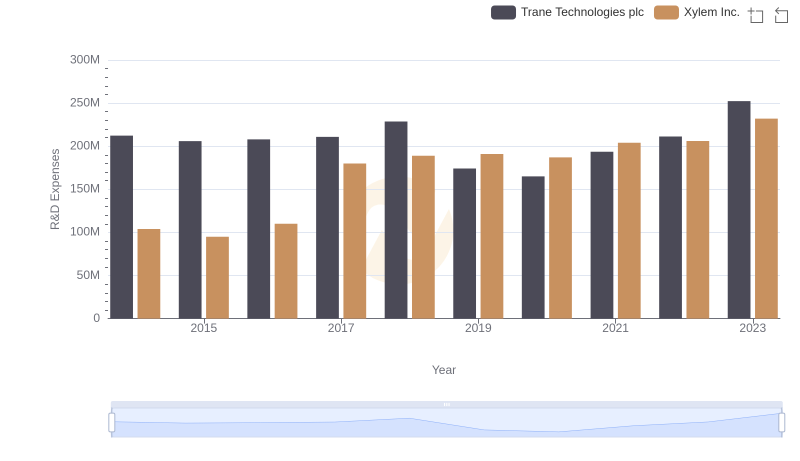
Research and Development Expenses Breakdown: Trane Technologies plc vs Xylem Inc.
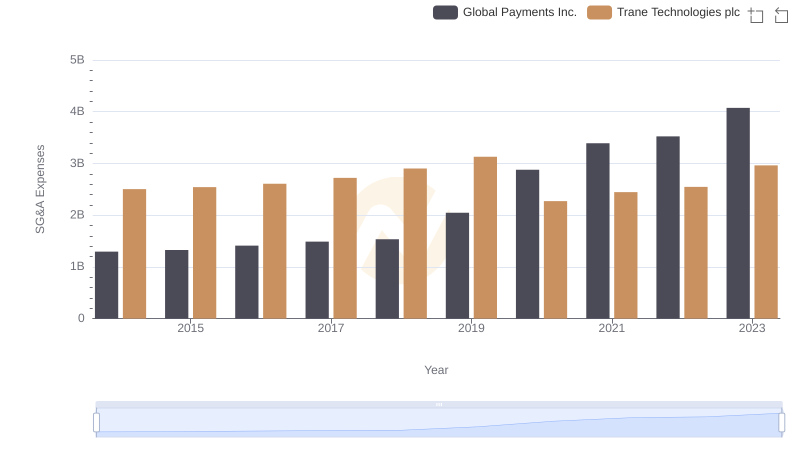
Breaking Down SG&A Expenses: Trane Technologies plc vs Global Payments Inc.
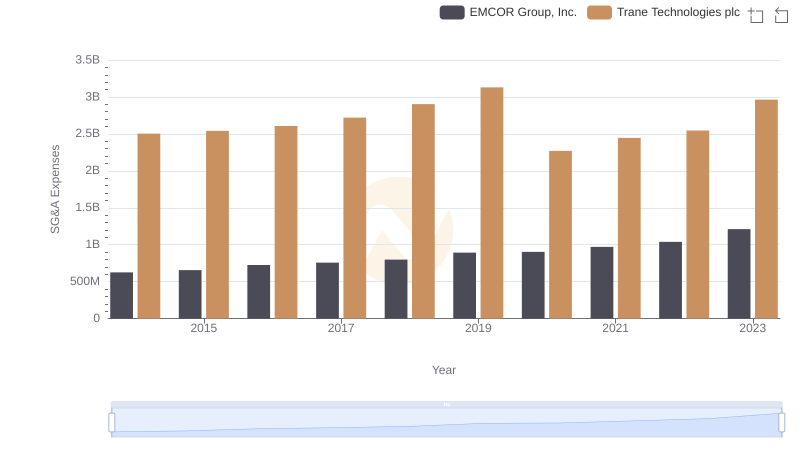
Trane Technologies plc vs EMCOR Group, Inc.: SG&A Expense Trends
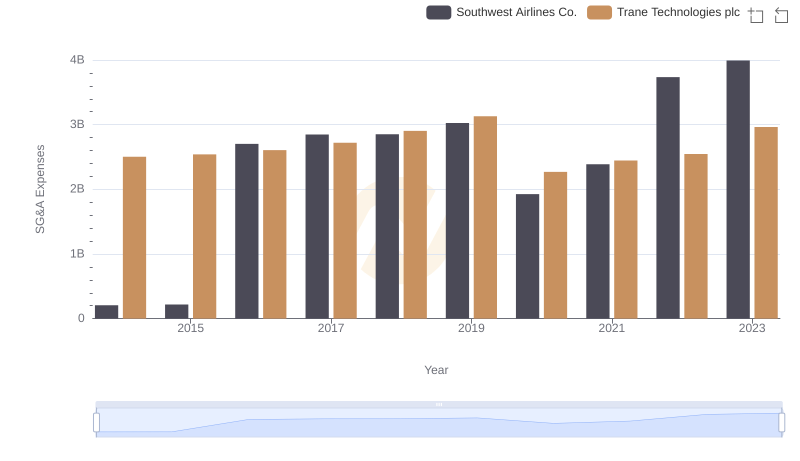
Operational Costs Compared: SG&A Analysis of Trane Technologies plc and Southwest Airlines Co.

Cost Management Insights: SG&A Expenses for Trane Technologies plc and Builders FirstSource, Inc.
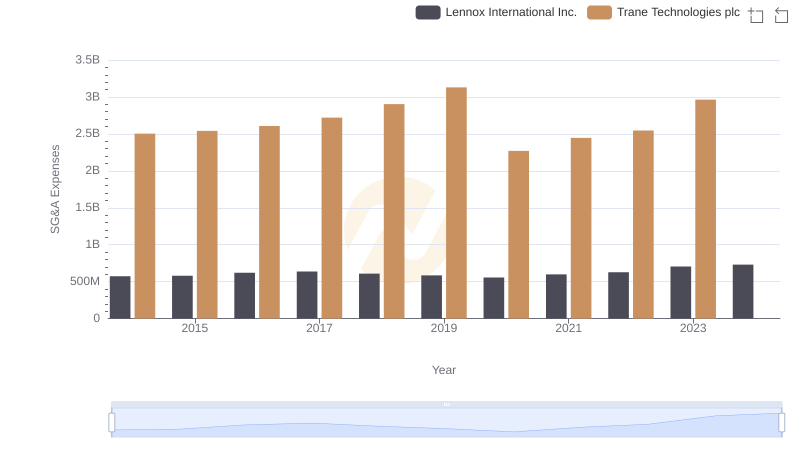
Selling, General, and Administrative Costs: Trane Technologies plc vs Lennox International Inc.
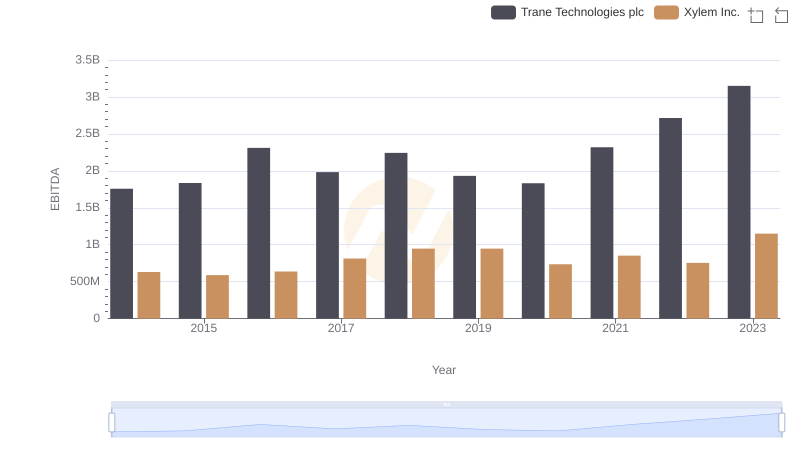
A Professional Review of EBITDA: Trane Technologies plc Compared to Xylem Inc.