| __timestamp | Nutanix, Inc. | QUALCOMM Incorporated |
|---|---|---|
| Wednesday, January 1, 2014 | 127127000 | 26487000000 |
| Thursday, January 1, 2015 | 241432000 | 25281000000 |
| Friday, January 1, 2016 | 444928000 | 23554000000 |
| Sunday, January 1, 2017 | 766869000 | 22291000000 |
| Monday, January 1, 2018 | 1155457000 | 22732000000 |
| Tuesday, January 1, 2019 | 1236143000 | 24273000000 |
| Wednesday, January 1, 2020 | 1307682000 | 23531000000 |
| Friday, January 1, 2021 | 1394364000 | 33566000000 |
| Saturday, January 1, 2022 | 1580796000 | 44200000000 |
| Sunday, January 1, 2023 | 1862895000 | 35820000000 |
| Monday, January 1, 2024 | 2148816000 | 38962000000 |
Unleashing the power of data
In the ever-evolving tech industry, revenue growth is a key indicator of a company's market position and potential. Over the past decade, Qualcomm Incorporated has consistently outpaced Nutanix, Inc. in annual revenue. From 2014 to 2024, Qualcomm's revenue surged by approximately 47%, peaking at nearly $39 billion in 2024. In contrast, Nutanix, a rising star in cloud computing, saw its revenue grow by an impressive 1,590% over the same period, reaching over $2 billion in 2024.
Despite Nutanix's rapid growth, Qualcomm's dominance remains unchallenged, with its revenue being nearly 20 times that of Nutanix in 2024. This data highlights the contrasting scales and growth trajectories of these two tech giants. As Nutanix continues to innovate, the gap may narrow, but Qualcomm's established market presence ensures it remains a formidable leader in the tech industry.
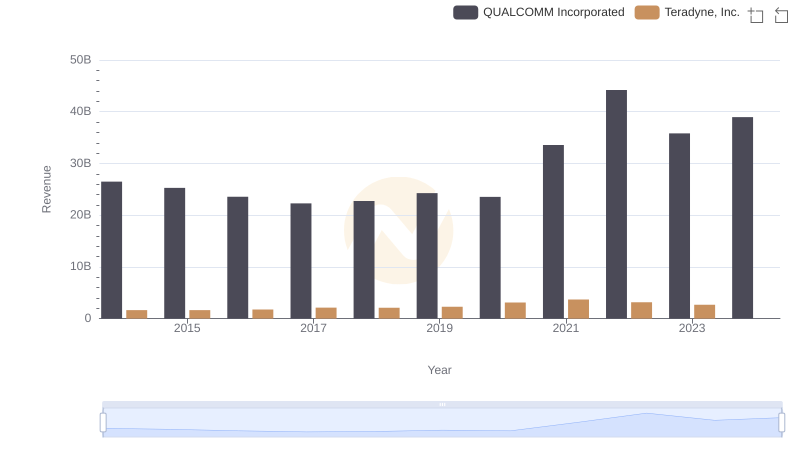
Revenue Showdown: QUALCOMM Incorporated vs Teradyne, Inc.
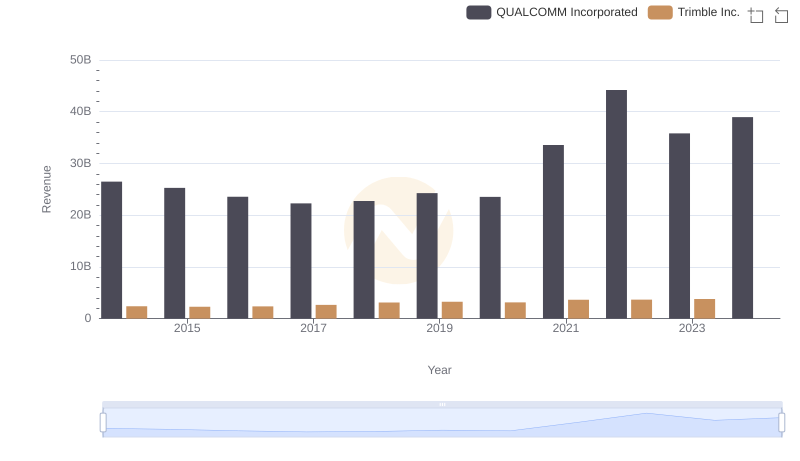
Revenue Insights: QUALCOMM Incorporated and Trimble Inc. Performance Compared
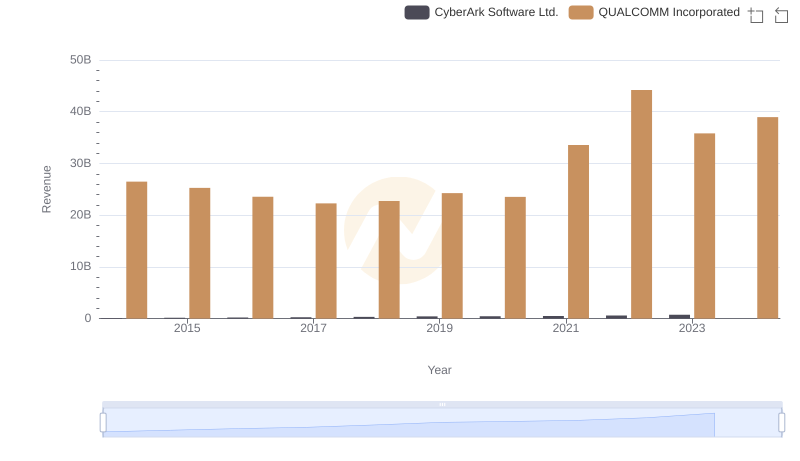
QUALCOMM Incorporated vs CyberArk Software Ltd.: Annual Revenue Growth Compared
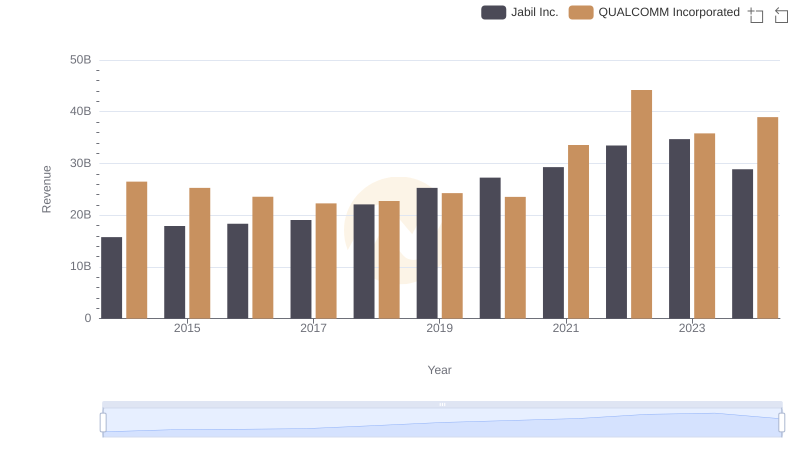
Breaking Down Revenue Trends: QUALCOMM Incorporated vs Jabil Inc.
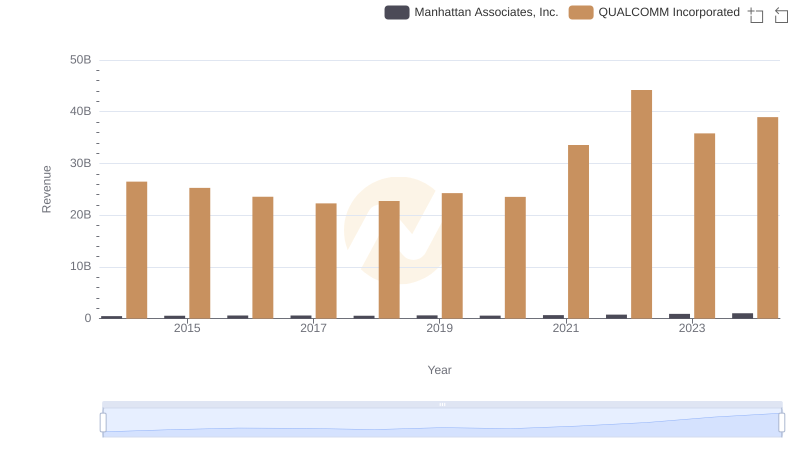
Who Generates More Revenue? QUALCOMM Incorporated or Manhattan Associates, Inc.
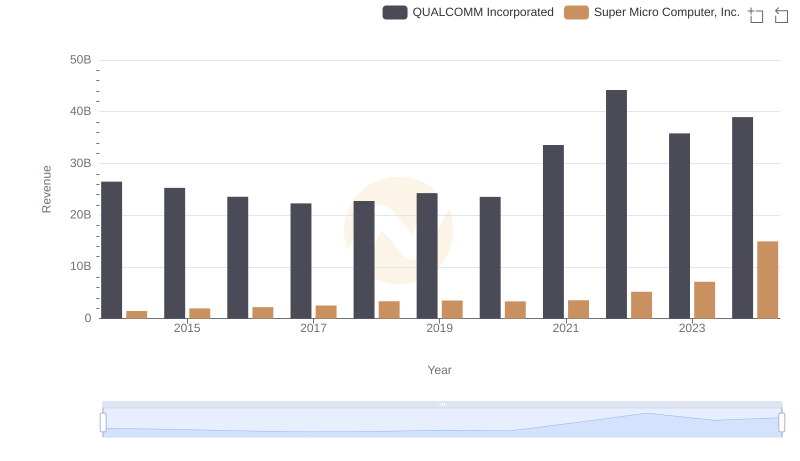
Revenue Insights: QUALCOMM Incorporated and Super Micro Computer, Inc. Performance Compared
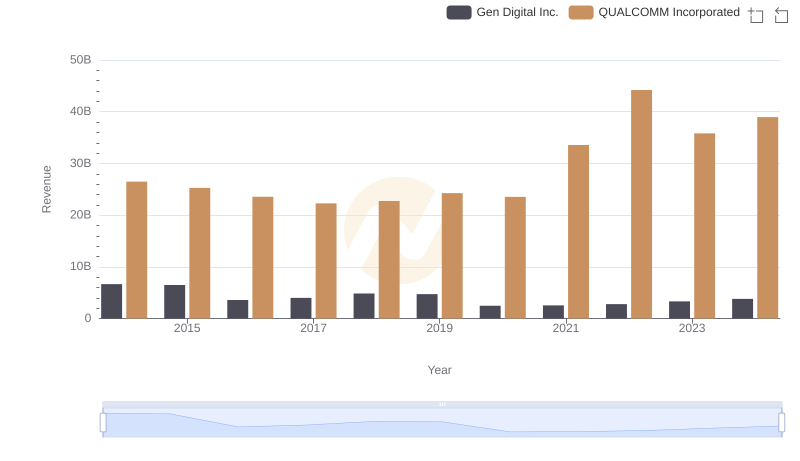
QUALCOMM Incorporated and Gen Digital Inc.: A Comprehensive Revenue Analysis

Comparing Revenue Performance: QUALCOMM Incorporated or Guidewire Software, Inc.?
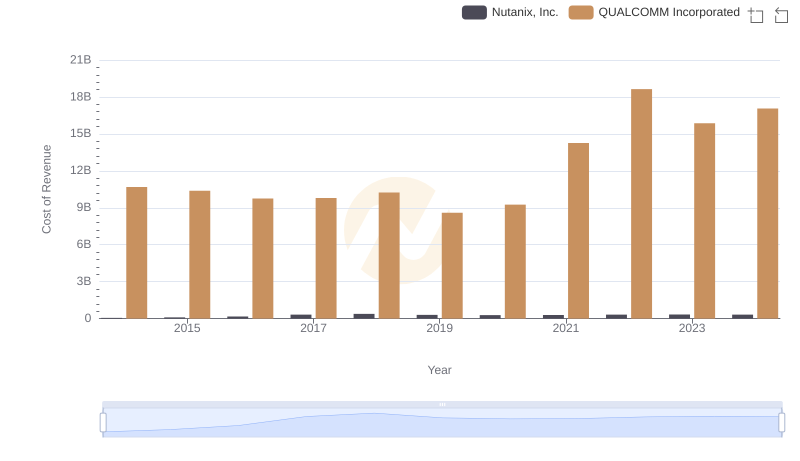
Cost of Revenue Comparison: QUALCOMM Incorporated vs Nutanix, Inc.
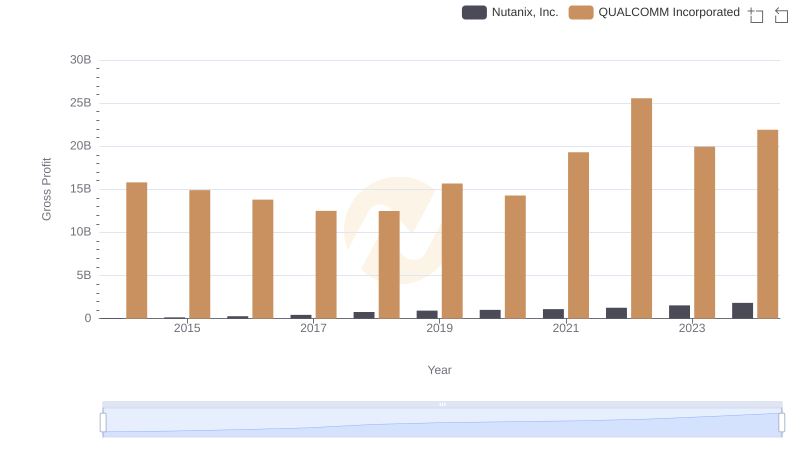
Gross Profit Trends Compared: QUALCOMM Incorporated vs Nutanix, Inc.
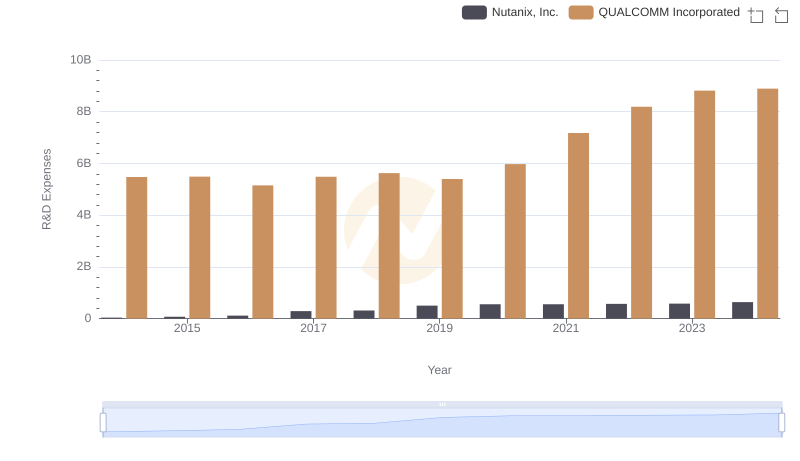
QUALCOMM Incorporated vs Nutanix, Inc.: Strategic Focus on R&D Spending
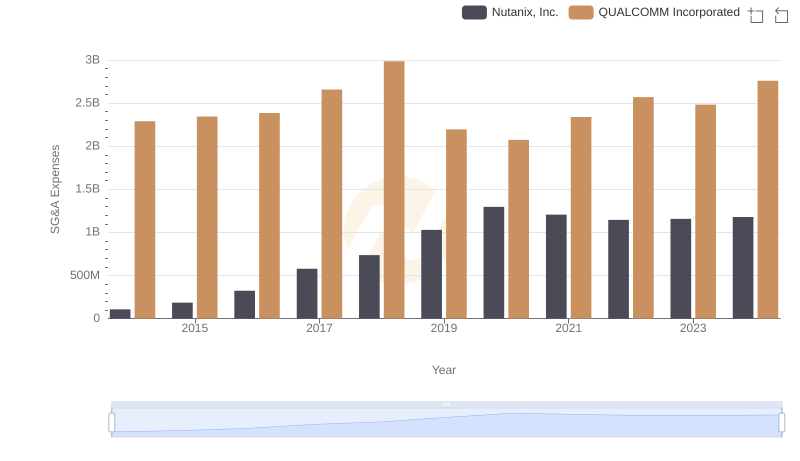
SG&A Efficiency Analysis: Comparing QUALCOMM Incorporated and Nutanix, Inc.