| __timestamp | Nutanix, Inc. | QUALCOMM Incorporated |
|---|---|---|
| Wednesday, January 1, 2014 | 66215000 | 15801000000 |
| Thursday, January 1, 2015 | 140473000 | 14903000000 |
| Friday, January 1, 2016 | 274141000 | 13805000000 |
| Sunday, January 1, 2017 | 439538000 | 12499000000 |
| Monday, January 1, 2018 | 769427000 | 12488000000 |
| Tuesday, January 1, 2019 | 932015000 | 15674000000 |
| Wednesday, January 1, 2020 | 1020993000 | 14276000000 |
| Friday, January 1, 2021 | 1102458000 | 19304000000 |
| Saturday, January 1, 2022 | 1259640000 | 25565000000 |
| Sunday, January 1, 2023 | 1530708000 | 19951000000 |
| Monday, January 1, 2024 | 1824704000 | 21902000000 |
Unlocking the unknown
In the ever-evolving landscape of technology, the financial performance of companies like QUALCOMM Incorporated and Nutanix, Inc. offers a fascinating glimpse into industry dynamics. Over the past decade, QUALCOMM has consistently outperformed Nutanix in terms of gross profit, with figures peaking at approximately $25.6 billion in 2022. This represents a staggering 1,500% increase compared to Nutanix's highest gross profit of around $1.8 billion in 2024.
QUALCOMM's gross profit trajectory showcases a robust growth pattern, with a notable 62% increase from 2014 to 2024. This growth underscores its dominance in the semiconductor industry, driven by innovations in mobile technology and 5G advancements.
Conversely, Nutanix, a leader in cloud computing solutions, has shown a remarkable 2,650% growth in gross profit since 2014. This reflects its expanding market presence and the increasing demand for cloud-based services.
The contrasting financial journeys of these two companies highlight the diverse opportunities and challenges within the tech sector.

Gross Profit Comparison: QUALCOMM Incorporated and Teradyne, Inc. Trends
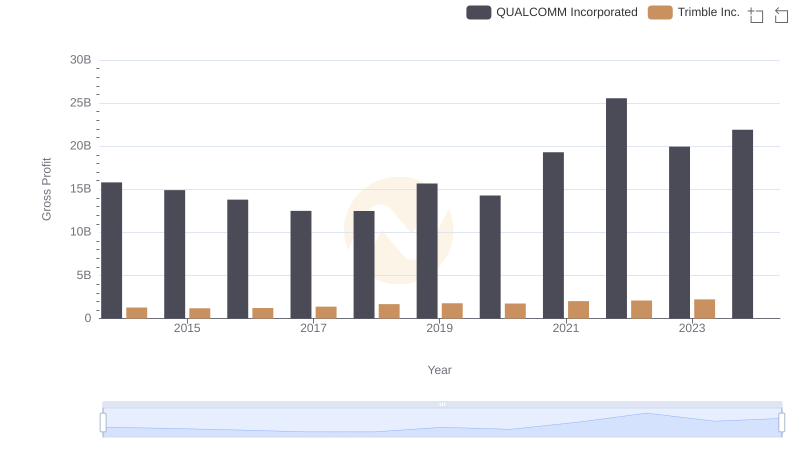
Gross Profit Trends Compared: QUALCOMM Incorporated vs Trimble Inc.
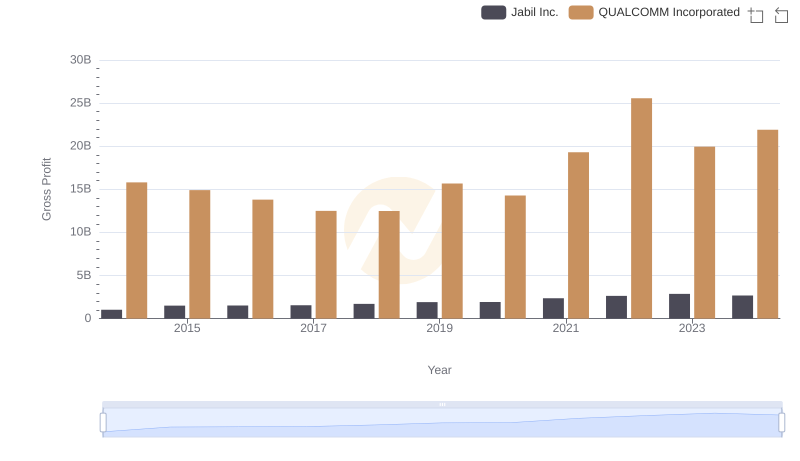
QUALCOMM Incorporated vs Jabil Inc.: A Gross Profit Performance Breakdown
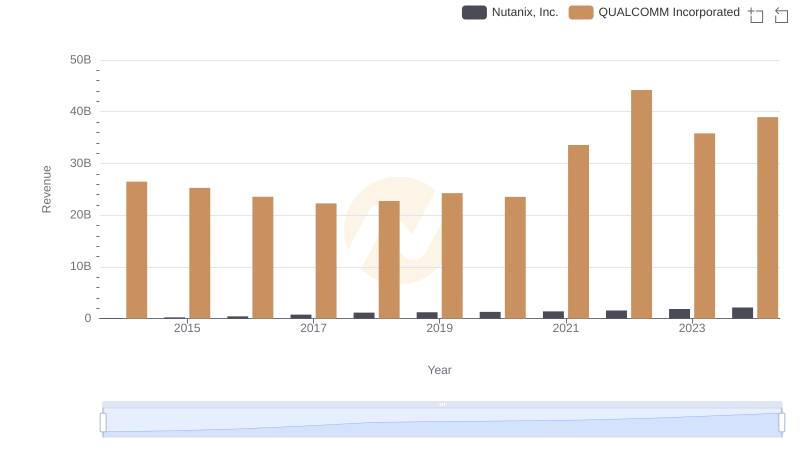
QUALCOMM Incorporated or Nutanix, Inc.: Who Leads in Yearly Revenue?
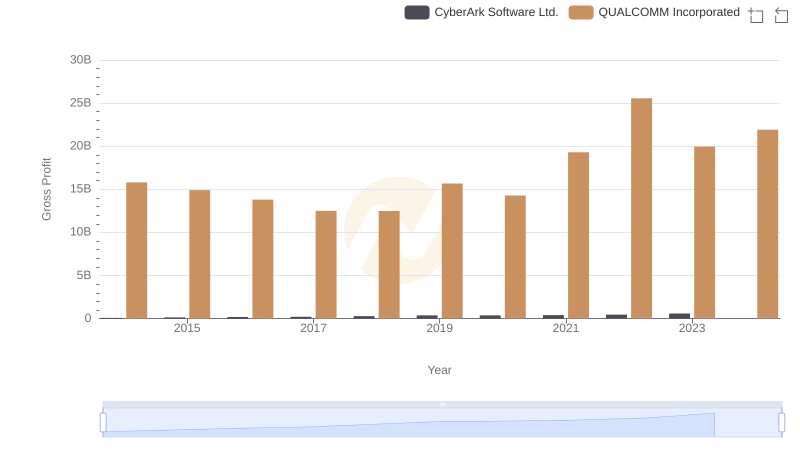
Key Insights on Gross Profit: QUALCOMM Incorporated vs CyberArk Software Ltd.
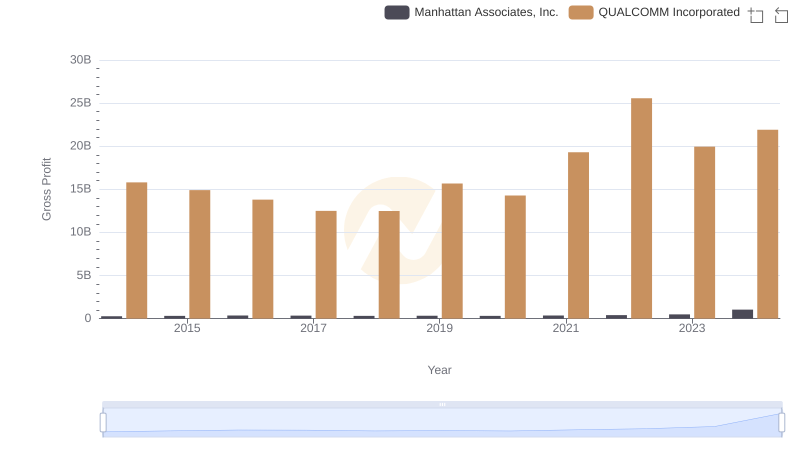
Gross Profit Analysis: Comparing QUALCOMM Incorporated and Manhattan Associates, Inc.
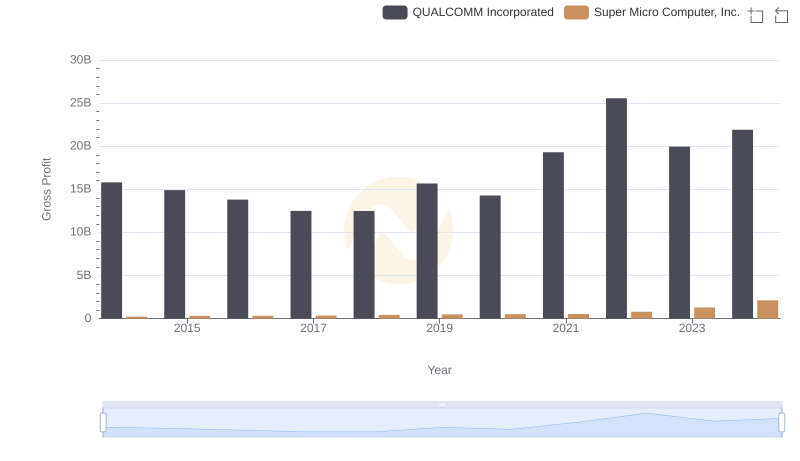
Gross Profit Trends Compared: QUALCOMM Incorporated vs Super Micro Computer, Inc.
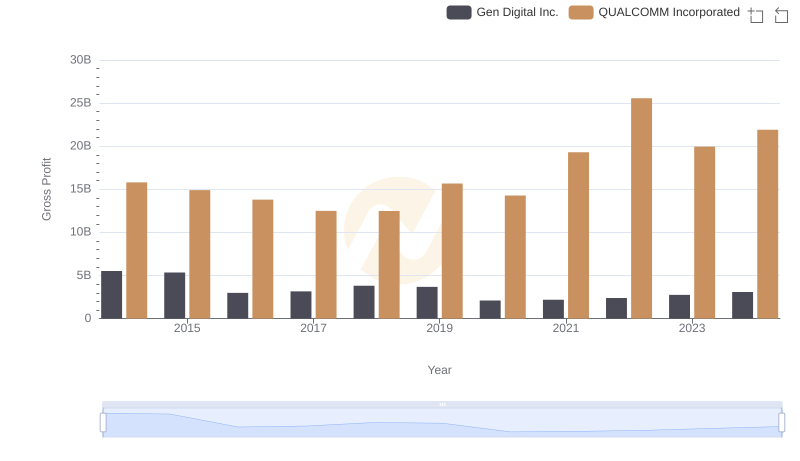
Key Insights on Gross Profit: QUALCOMM Incorporated vs Gen Digital Inc.
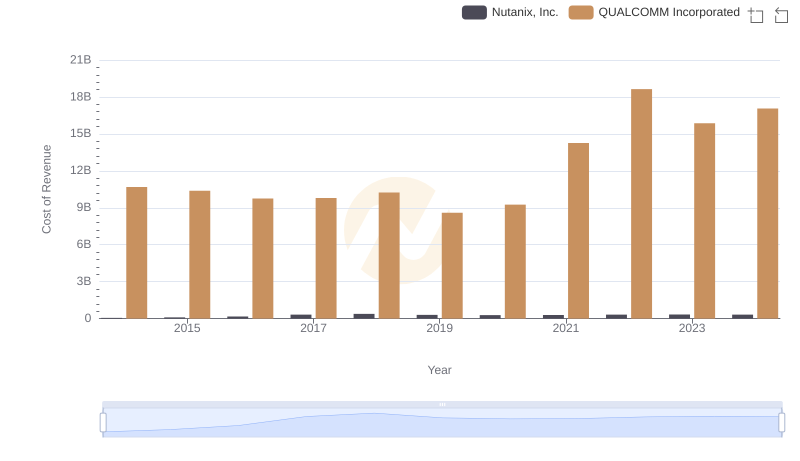
Cost of Revenue Comparison: QUALCOMM Incorporated vs Nutanix, Inc.
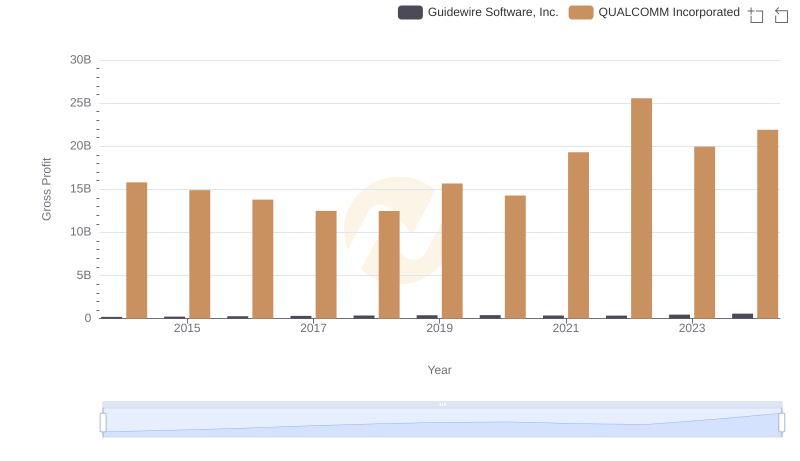
QUALCOMM Incorporated vs Guidewire Software, Inc.: A Gross Profit Performance Breakdown
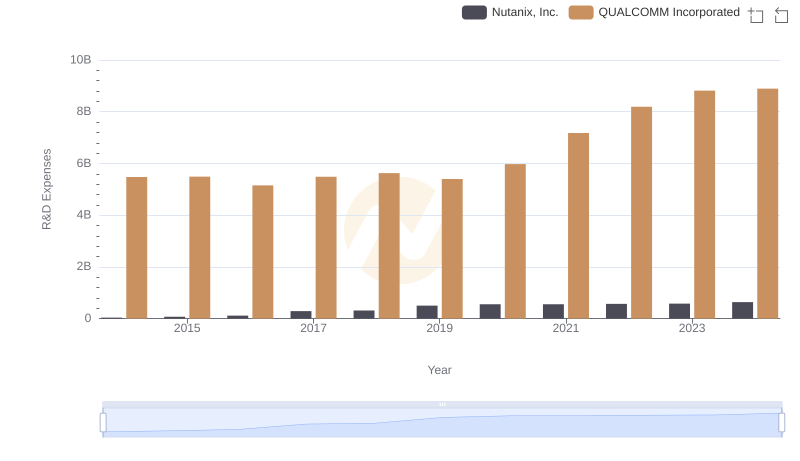
QUALCOMM Incorporated vs Nutanix, Inc.: Strategic Focus on R&D Spending
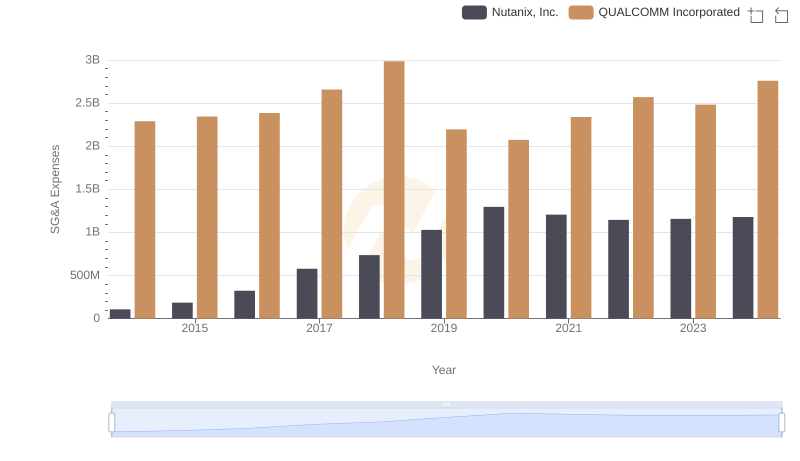
SG&A Efficiency Analysis: Comparing QUALCOMM Incorporated and Nutanix, Inc.