| __timestamp | Nutanix, Inc. | QUALCOMM Incorporated |
|---|---|---|
| Wednesday, January 1, 2014 | 60912000 | 10686000000 |
| Thursday, January 1, 2015 | 100959000 | 10378000000 |
| Friday, January 1, 2016 | 170787000 | 9749000000 |
| Sunday, January 1, 2017 | 327331000 | 9792000000 |
| Monday, January 1, 2018 | 386030000 | 10244000000 |
| Tuesday, January 1, 2019 | 304128000 | 8599000000 |
| Wednesday, January 1, 2020 | 286689000 | 9255000000 |
| Friday, January 1, 2021 | 291906000 | 14262000000 |
| Saturday, January 1, 2022 | 321156000 | 18635000000 |
| Sunday, January 1, 2023 | 332187000 | 15869000000 |
| Monday, January 1, 2024 | 324112000 | 17060000000 |
Unleashing the power of data
In the ever-evolving tech landscape, understanding cost structures is crucial. This chart offers a fascinating glimpse into the cost of revenue trends for QUALCOMM Incorporated and Nutanix, Inc. over the past decade.
From 2014 to 2024, QUALCOMM's cost of revenue consistently dwarfs that of Nutanix, averaging around $12.2 billion annually. This reflects its expansive operations and market reach. Notably, 2022 marked a peak with costs reaching approximately $18.6 billion, a 75% increase from 2019.
Conversely, Nutanix, a cloud computing leader, shows a steady rise in costs, peaking at $386 million in 2018. Despite being a fraction of QUALCOMM's, Nutanix's costs have grown over 400% since 2014, highlighting its rapid expansion.
This comparison underscores the diverse strategies and market positions of these tech giants, offering valuable insights for investors and industry watchers.
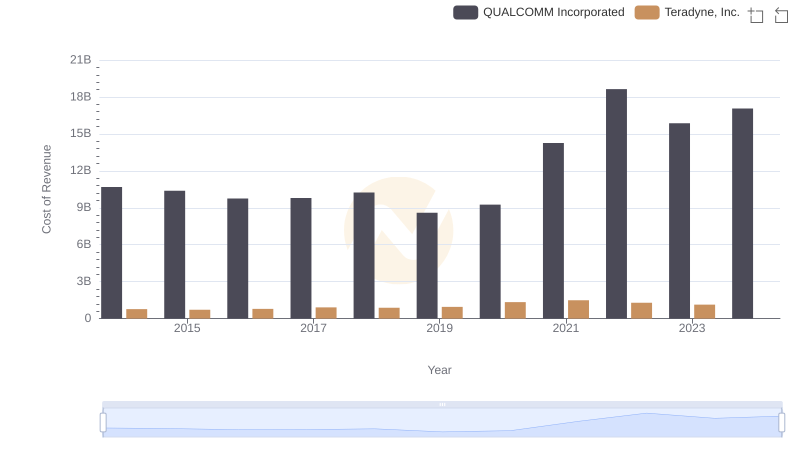
Cost Insights: Breaking Down QUALCOMM Incorporated and Teradyne, Inc.'s Expenses
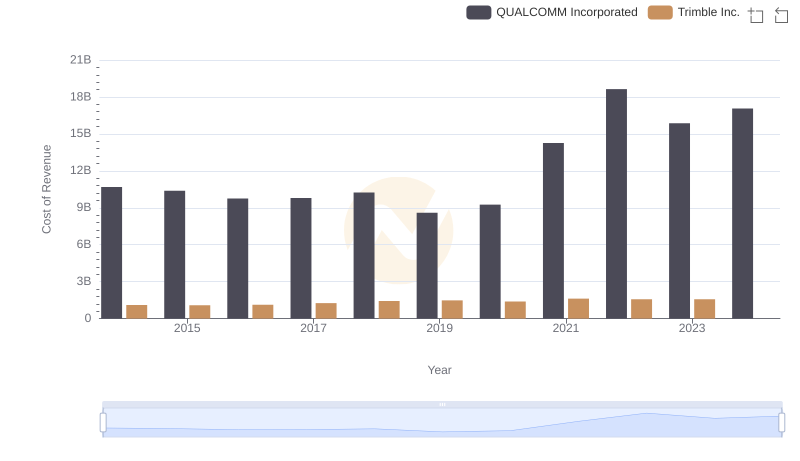
Comparing Cost of Revenue Efficiency: QUALCOMM Incorporated vs Trimble Inc.
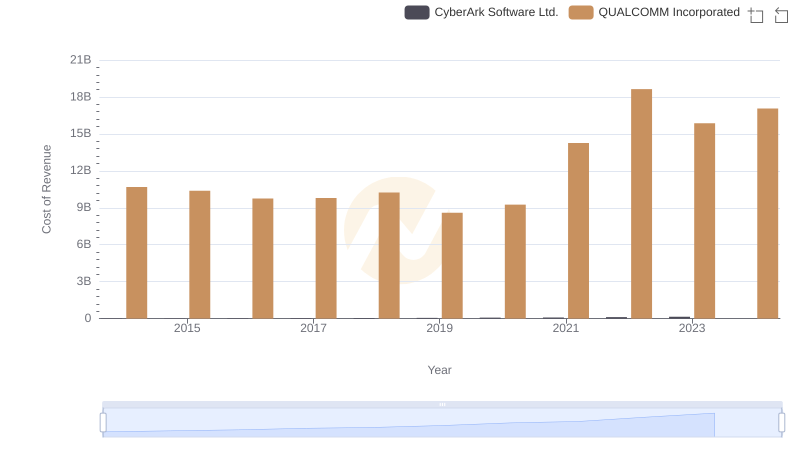
Cost of Revenue: Key Insights for QUALCOMM Incorporated and CyberArk Software Ltd.
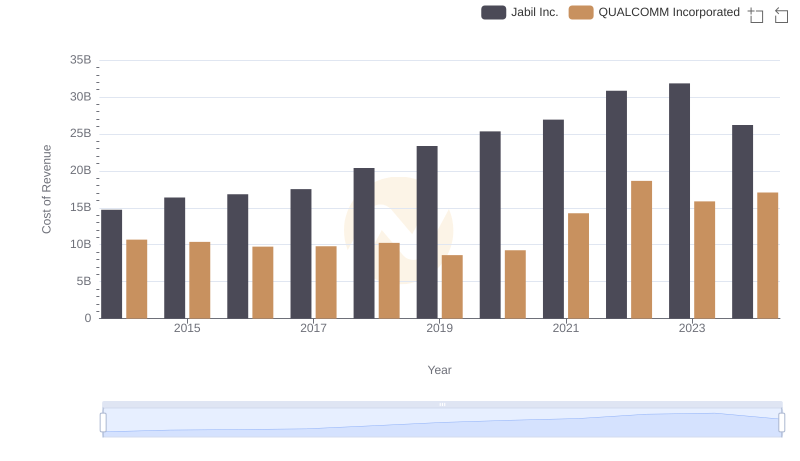
Cost of Revenue Comparison: QUALCOMM Incorporated vs Jabil Inc.

Cost Insights: Breaking Down QUALCOMM Incorporated and Manhattan Associates, Inc.'s Expenses
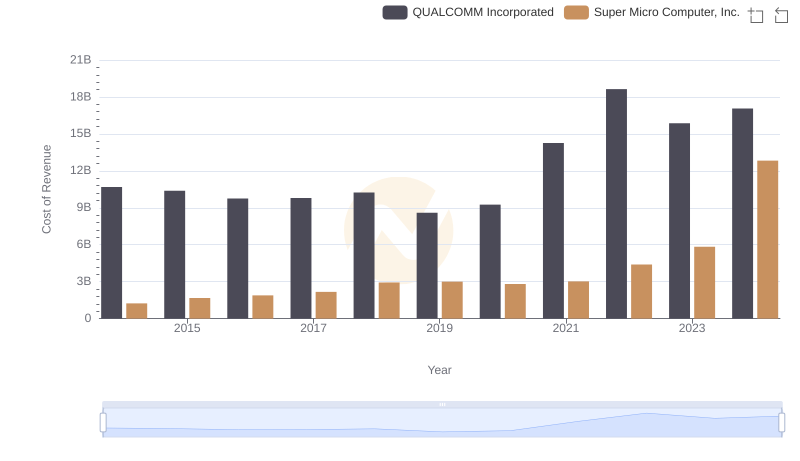
Cost of Revenue: Key Insights for QUALCOMM Incorporated and Super Micro Computer, Inc.
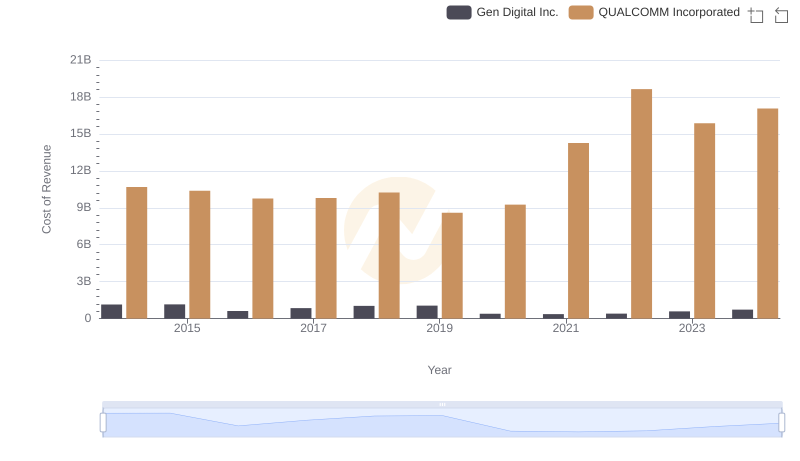
Cost of Revenue Comparison: QUALCOMM Incorporated vs Gen Digital Inc.
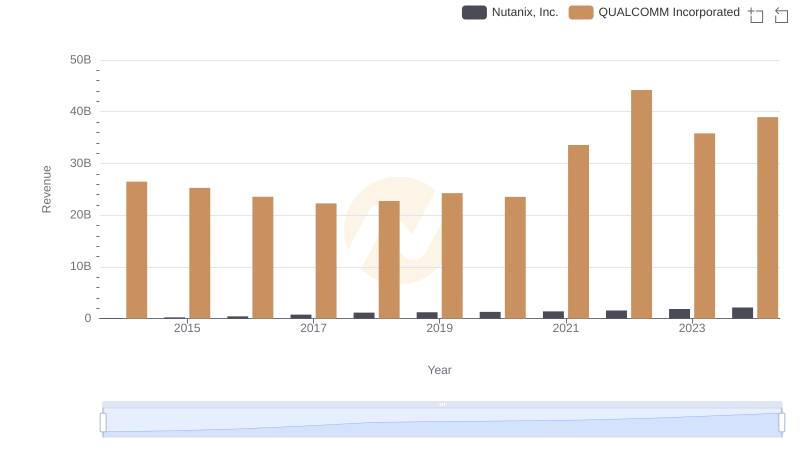
QUALCOMM Incorporated or Nutanix, Inc.: Who Leads in Yearly Revenue?
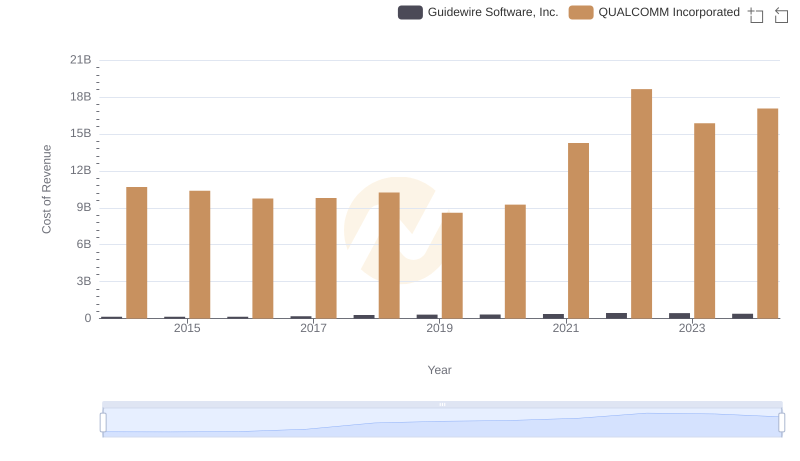
Cost of Revenue Trends: QUALCOMM Incorporated vs Guidewire Software, Inc.
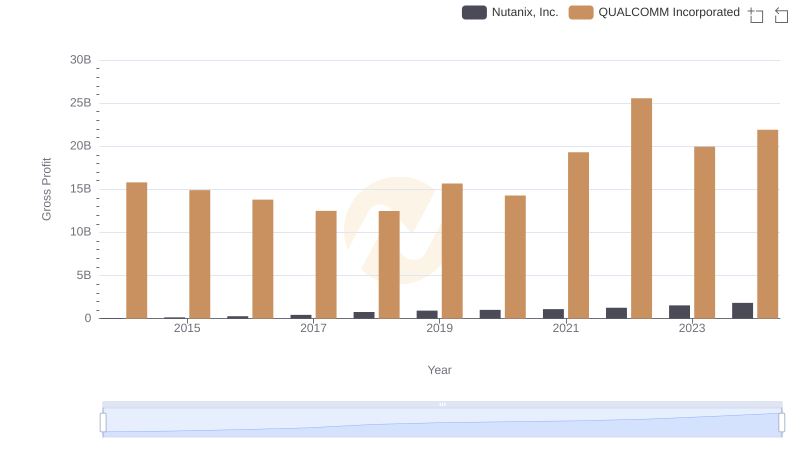
Gross Profit Trends Compared: QUALCOMM Incorporated vs Nutanix, Inc.
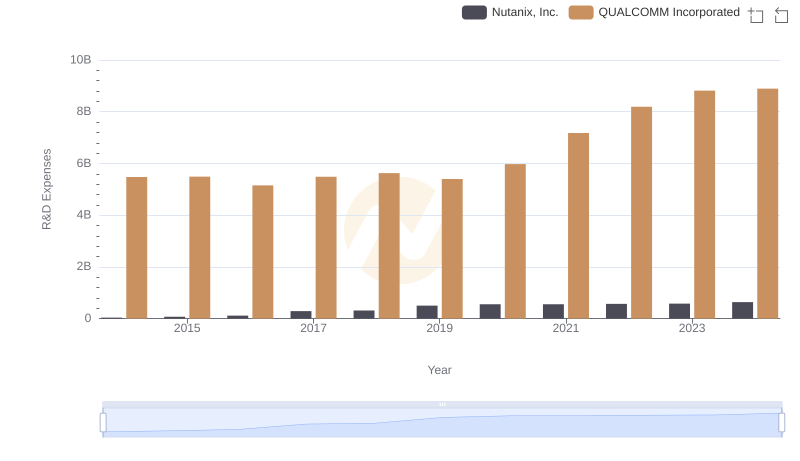
QUALCOMM Incorporated vs Nutanix, Inc.: Strategic Focus on R&D Spending
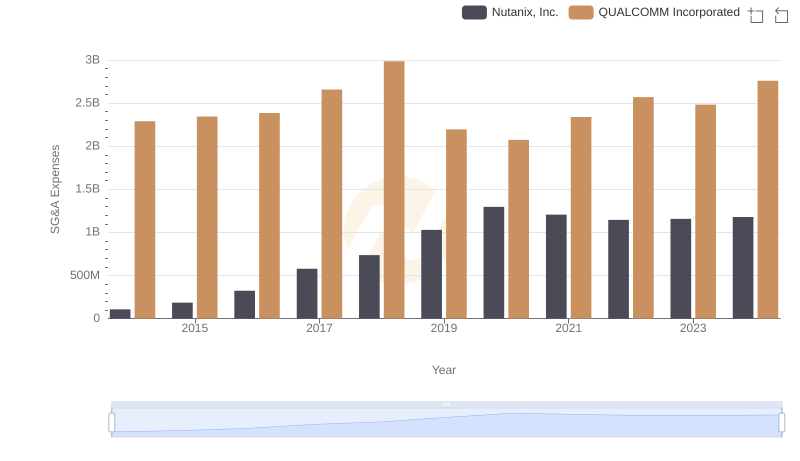
SG&A Efficiency Analysis: Comparing QUALCOMM Incorporated and Nutanix, Inc.