| __timestamp | International Business Machines Corporation | Nokia Oyj |
|---|---|---|
| Wednesday, January 1, 2014 | 22472000000 | 1634000000 |
| Thursday, January 1, 2015 | 19894000000 | 1651000000 |
| Friday, January 1, 2016 | 20279000000 | 3819000000 |
| Sunday, January 1, 2017 | 19680000000 | 3615000000 |
| Monday, January 1, 2018 | 19366000000 | 3463000000 |
| Tuesday, January 1, 2019 | 18724000000 | 3101000000 |
| Wednesday, January 1, 2020 | 20561000000 | 2898000000 |
| Friday, January 1, 2021 | 18745000000 | 2792000000 |
| Saturday, January 1, 2022 | 17483000000 | 3013000000 |
| Sunday, January 1, 2023 | 17997000000 | 2929000000 |
| Monday, January 1, 2024 | 29536000000 |
Infusing magic into the data realm
In the ever-evolving landscape of global technology, the efficiency of Selling, General, and Administrative (SG&A) expenses is a critical metric for assessing corporate health. Over the past decade, International Business Machines Corporation (IBM) and Nokia Oyj have showcased contrasting trends in their SG&A expenditures.
From 2014 to 2023, IBM's SG&A expenses fluctuated, peaking in 2024 with a 42% increase from its lowest point in 2023. This suggests strategic investments or restructuring efforts. Meanwhile, Nokia's SG&A expenses remained relatively stable, with a notable spike in 2016, doubling from the previous year, possibly reflecting a strategic pivot or market expansion.
The data highlights IBM's dynamic approach compared to Nokia's steadier path, offering insights into their operational strategies. Missing data for 2024 in Nokia's records suggests a need for further investigation into recent trends.
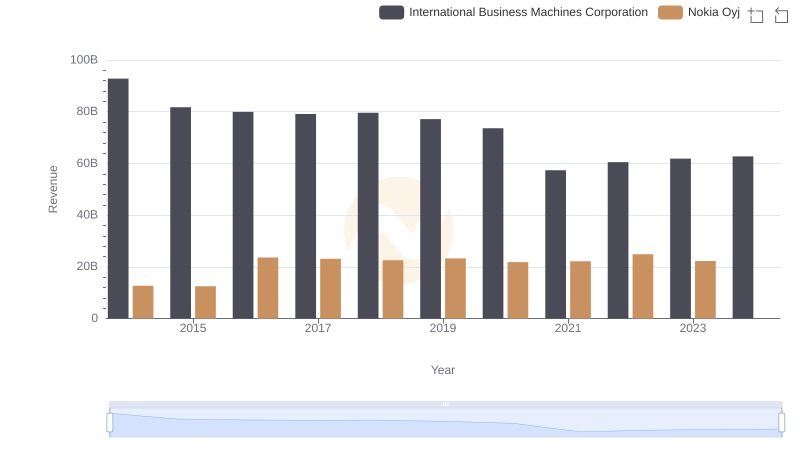
International Business Machines Corporation or Nokia Oyj: Who Leads in Yearly Revenue?
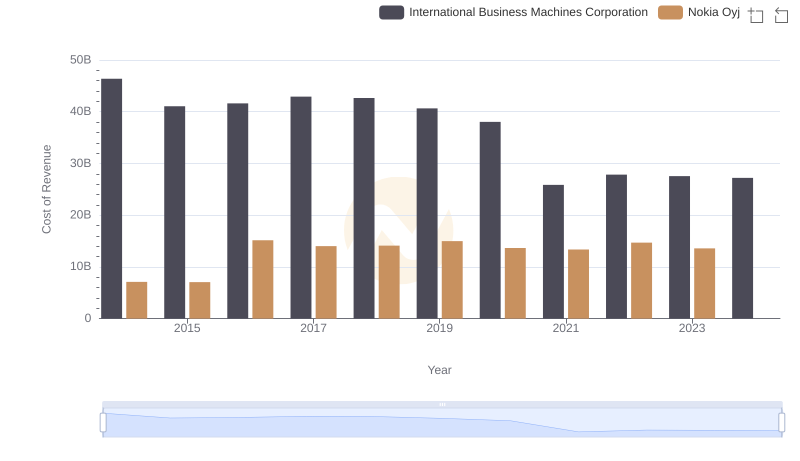
Analyzing Cost of Revenue: International Business Machines Corporation and Nokia Oyj
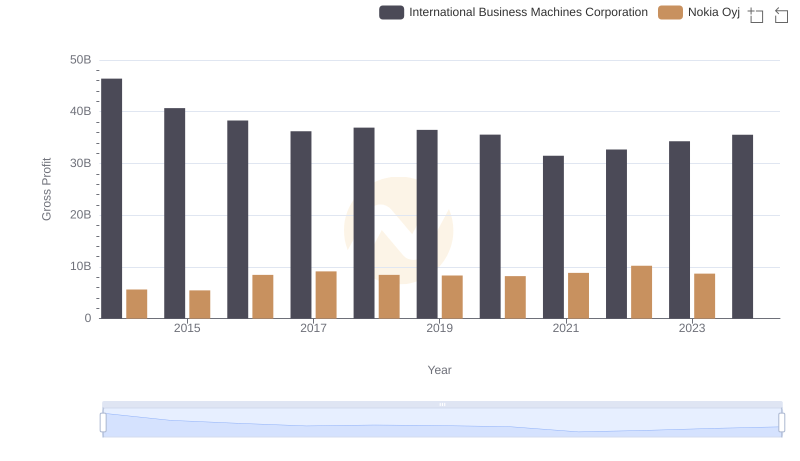
Gross Profit Comparison: International Business Machines Corporation and Nokia Oyj Trends
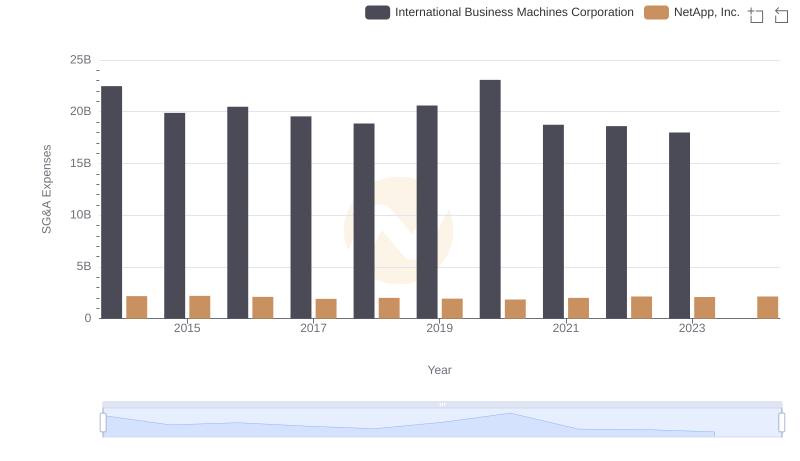
Who Optimizes SG&A Costs Better? International Business Machines Corporation or NetApp, Inc.

SG&A Efficiency Analysis: Comparing International Business Machines Corporation and Teledyne Technologies Incorporated
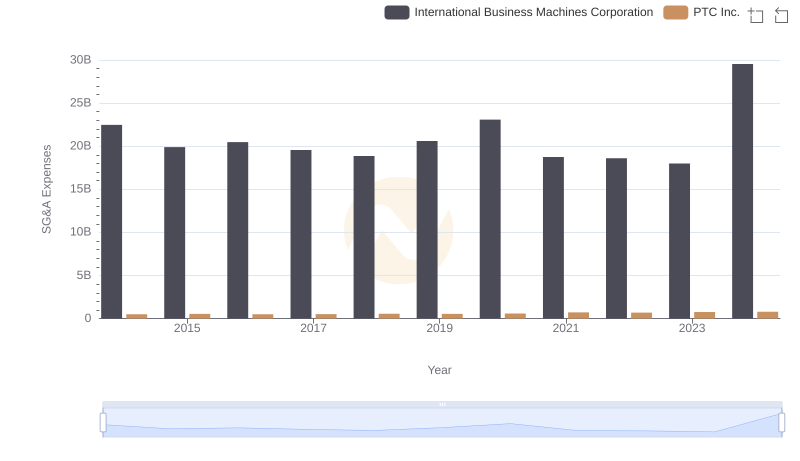
International Business Machines Corporation vs PTC Inc.: SG&A Expense Trends
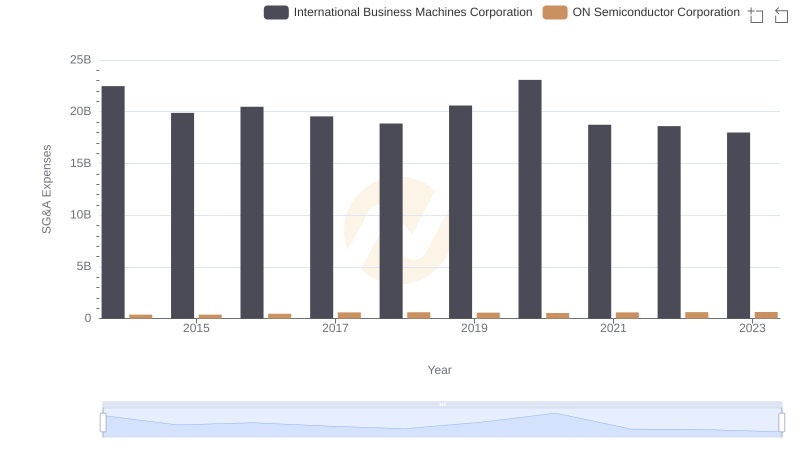
Breaking Down SG&A Expenses: International Business Machines Corporation vs ON Semiconductor Corporation
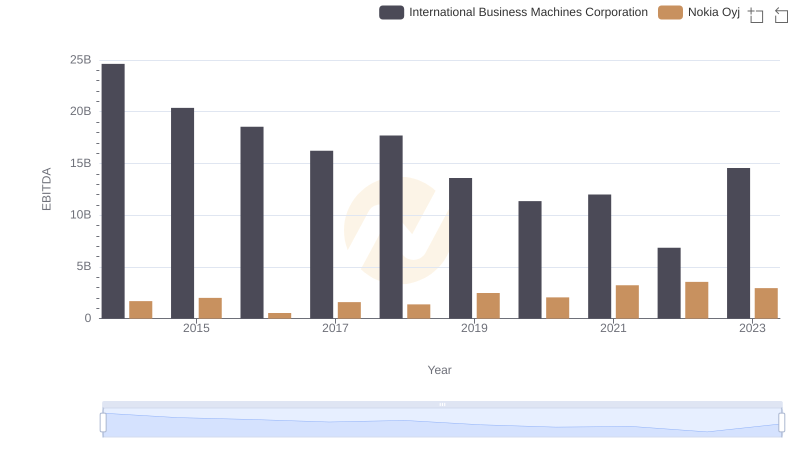
Professional EBITDA Benchmarking: International Business Machines Corporation vs Nokia Oyj
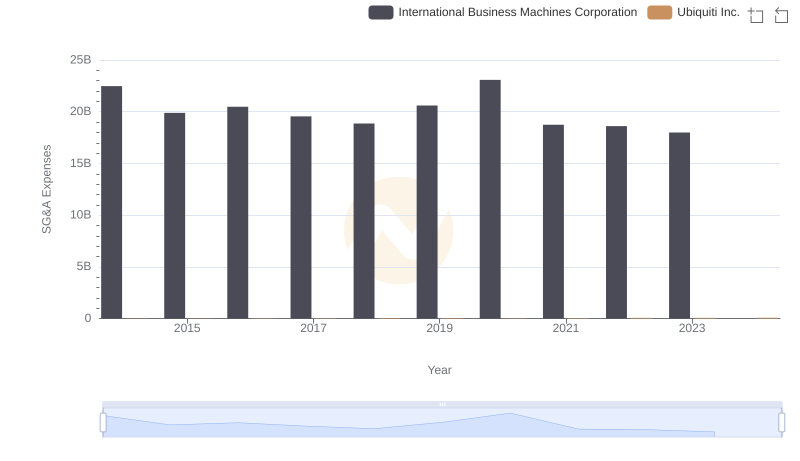
Breaking Down SG&A Expenses: International Business Machines Corporation vs Ubiquiti Inc.
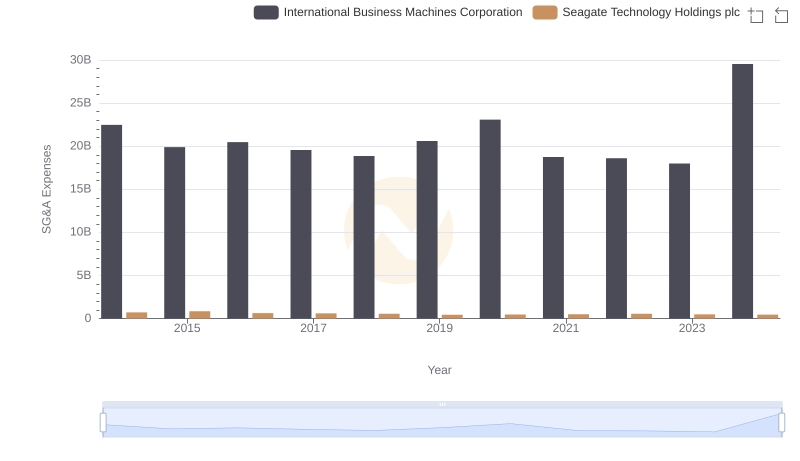
Cost Management Insights: SG&A Expenses for International Business Machines Corporation and Seagate Technology Holdings plc
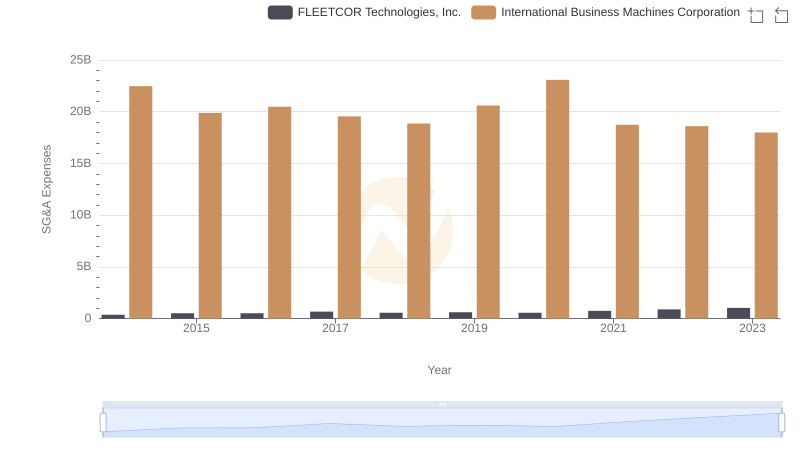
International Business Machines Corporation vs FLEETCOR Technologies, Inc.: SG&A Expense Trends