| __timestamp | Automatic Data Processing, Inc. | Global Payments Inc. |
|---|---|---|
| Wednesday, January 1, 2014 | 2762400000 | 1295014000 |
| Thursday, January 1, 2015 | 2496900000 | 1325567000 |
| Friday, January 1, 2016 | 2637000000 | 1411096000 |
| Sunday, January 1, 2017 | 2783200000 | 1488258000 |
| Monday, January 1, 2018 | 2971500000 | 1534297000 |
| Tuesday, January 1, 2019 | 3064200000 | 2046672000 |
| Wednesday, January 1, 2020 | 3003000000 | 2878878000 |
| Friday, January 1, 2021 | 3040500000 | 3391161000 |
| Saturday, January 1, 2022 | 3233200000 | 3524578000 |
| Sunday, January 1, 2023 | 3551400000 | 4073768000 |
| Monday, January 1, 2024 | 3778900000 | 4285307000 |
Infusing magic into the data realm
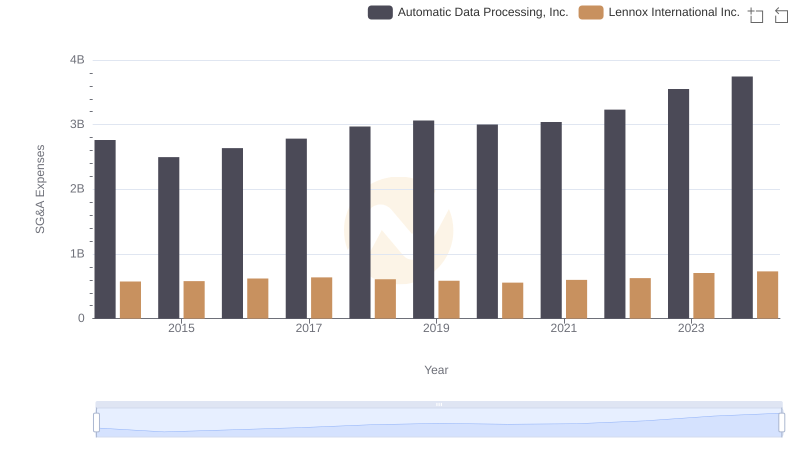
In the ever-evolving landscape of financial services, understanding operational efficiency is crucial. This analysis delves into the Selling, General, and Administrative (SG&A) expenses of Automatic Data Processing, Inc. (ADP) and Global Payments Inc. over the past decade. From 2014 to 2023, ADP's SG&A expenses grew by approximately 36%, reflecting a steady increase in operational costs. In contrast, Global Payments Inc. saw a staggering 214% rise, highlighting a more aggressive expansion strategy.
This comparison underscores the diverse strategies of these industry leaders, offering insights into their operational priorities and market positioning.
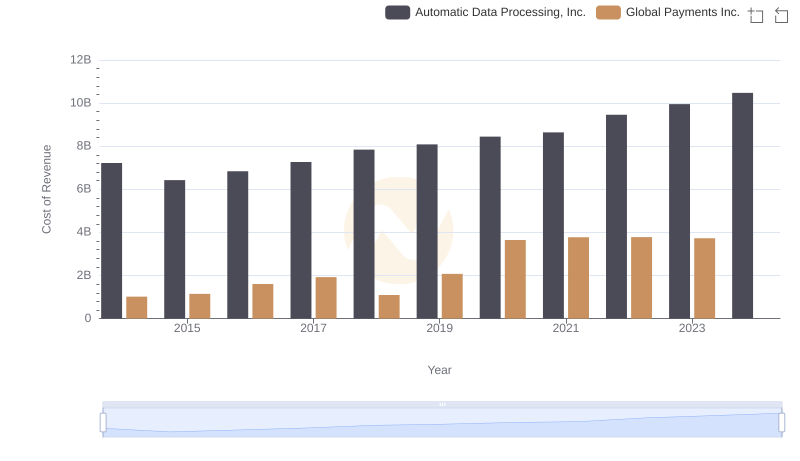
Cost of Revenue: Key Insights for Automatic Data Processing, Inc. and Global Payments Inc.
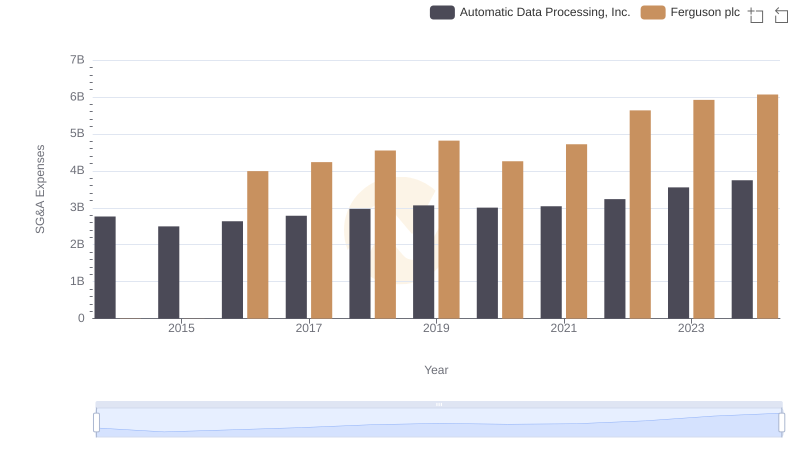
Who Optimizes SG&A Costs Better? Automatic Data Processing, Inc. or Ferguson plc
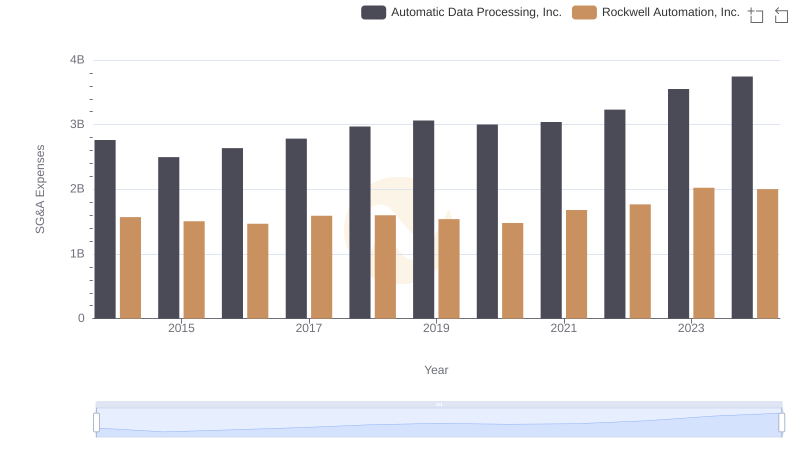
Operational Costs Compared: SG&A Analysis of Automatic Data Processing, Inc. and Rockwell Automation, Inc.
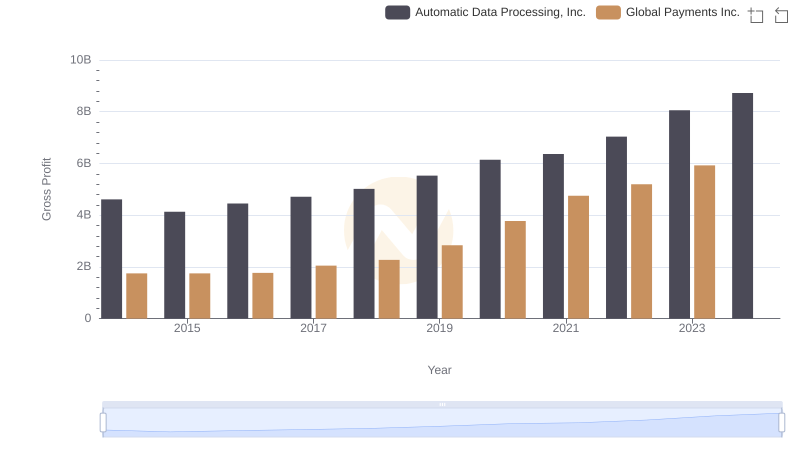
Automatic Data Processing, Inc. and Global Payments Inc.: A Detailed Gross Profit Analysis
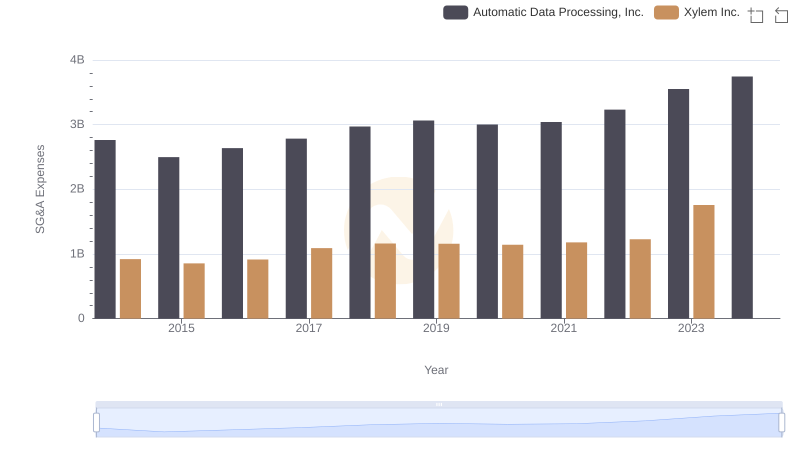
Cost Management Insights: SG&A Expenses for Automatic Data Processing, Inc. and Xylem Inc.
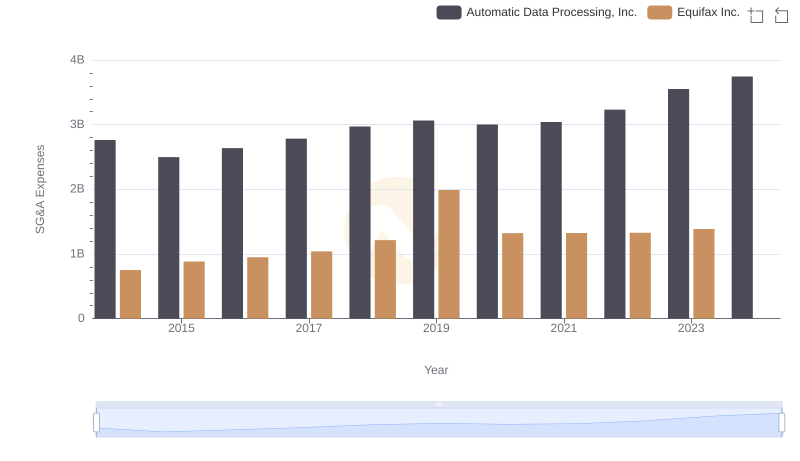
Operational Costs Compared: SG&A Analysis of Automatic Data Processing, Inc. and Equifax Inc.
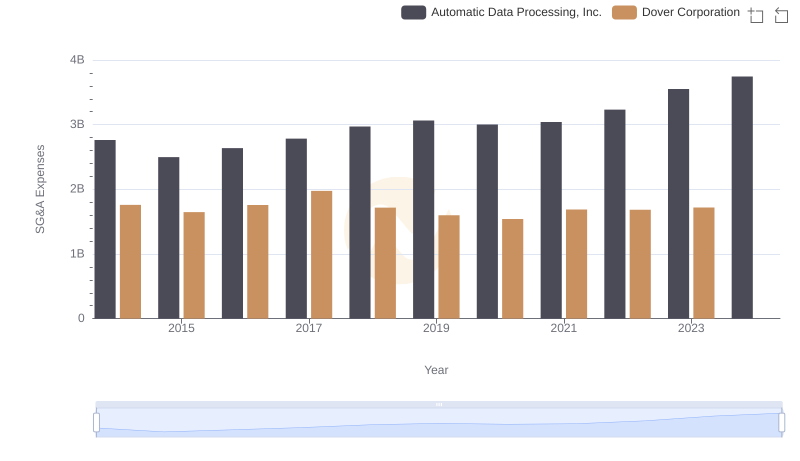
Automatic Data Processing, Inc. and Dover Corporation: SG&A Spending Patterns Compared
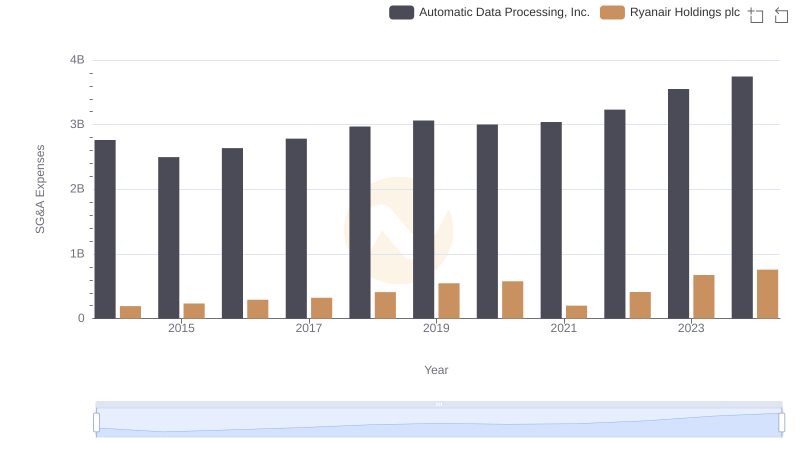
SG&A Efficiency Analysis: Comparing Automatic Data Processing, Inc. and Ryanair Holdings plc
Who Optimizes SG&A Costs Better? Automatic Data Processing, Inc. or Lennox International Inc.