| __timestamp | Automatic Data Processing, Inc. | Rockwell Automation, Inc. |
|---|---|---|
| Wednesday, January 1, 2014 | 2762400000 | 1570100000 |
| Thursday, January 1, 2015 | 2496900000 | 1506400000 |
| Friday, January 1, 2016 | 2637000000 | 1467400000 |
| Sunday, January 1, 2017 | 2783200000 | 1591500000 |
| Monday, January 1, 2018 | 2971500000 | 1599000000 |
| Tuesday, January 1, 2019 | 3064200000 | 1538500000 |
| Wednesday, January 1, 2020 | 3003000000 | 1479800000 |
| Friday, January 1, 2021 | 3040500000 | 1680000000 |
| Saturday, January 1, 2022 | 3233200000 | 1766700000 |
| Sunday, January 1, 2023 | 3551400000 | 2023700000 |
| Monday, January 1, 2024 | 3778900000 | 2002600000 |
Unleashing insights
In the ever-evolving landscape of corporate finance, understanding operational costs is crucial. Over the past decade, Automatic Data Processing, Inc. (ADP) and Rockwell Automation, Inc. have demonstrated distinct trends in their Selling, General, and Administrative (SG&A) expenses. From 2014 to 2024, ADP's SG&A expenses have surged by approximately 36%, reflecting a strategic expansion and investment in operational capabilities. In contrast, Rockwell Automation has seen a more modest increase of around 28% in the same period, indicating a steady yet cautious approach to managing operational costs.
The year 2023 marked a significant milestone, with ADP's expenses peaking at nearly 3.55 billion, while Rockwell Automation reached 2.02 billion. This divergence highlights ADP's aggressive growth strategy compared to Rockwell's more conservative fiscal management. As we look to the future, these trends offer valuable insights into the strategic priorities of these industry giants.

Comparing Cost of Revenue Efficiency: Automatic Data Processing, Inc. vs Rockwell Automation, Inc.
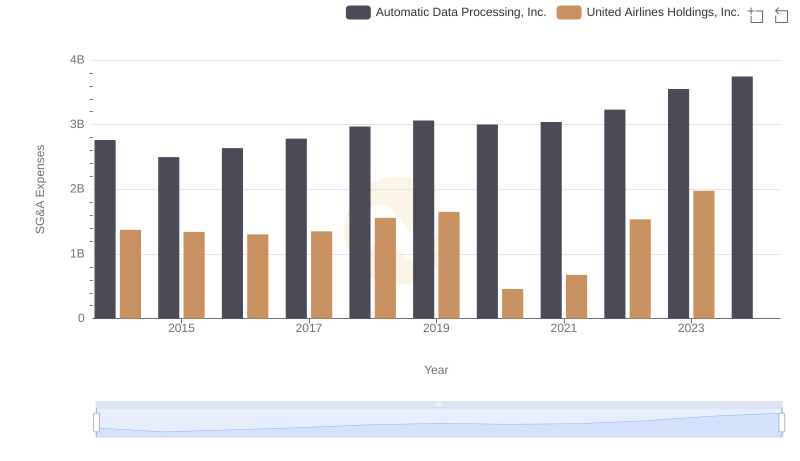
Breaking Down SG&A Expenses: Automatic Data Processing, Inc. vs United Airlines Holdings, Inc.
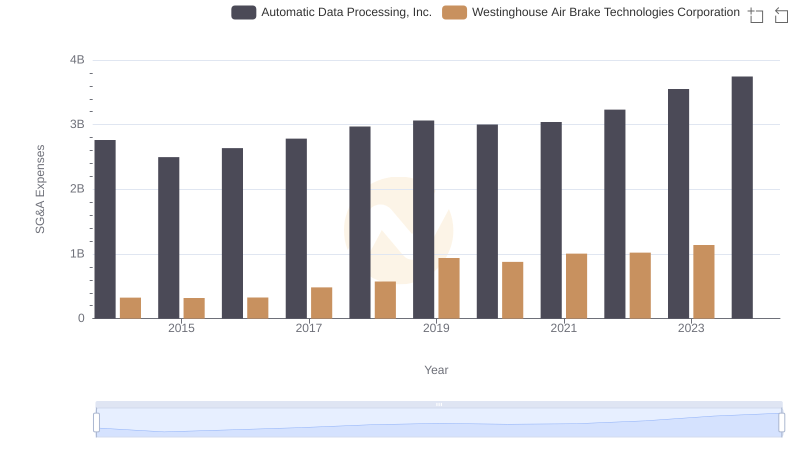
Comparing SG&A Expenses: Automatic Data Processing, Inc. vs Westinghouse Air Brake Technologies Corporation Trends and Insights
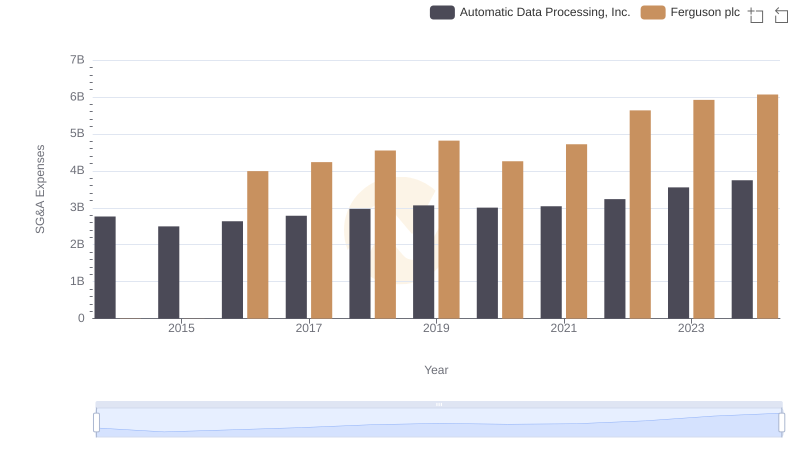
Who Optimizes SG&A Costs Better? Automatic Data Processing, Inc. or Ferguson plc
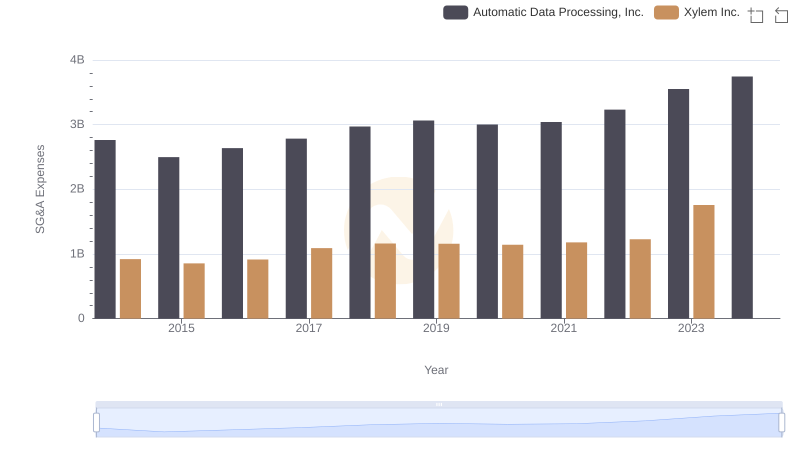
Cost Management Insights: SG&A Expenses for Automatic Data Processing, Inc. and Xylem Inc.
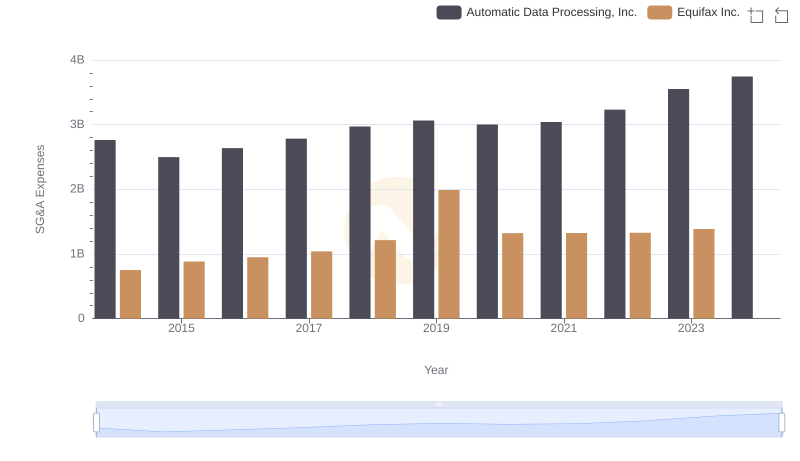
Operational Costs Compared: SG&A Analysis of Automatic Data Processing, Inc. and Equifax Inc.
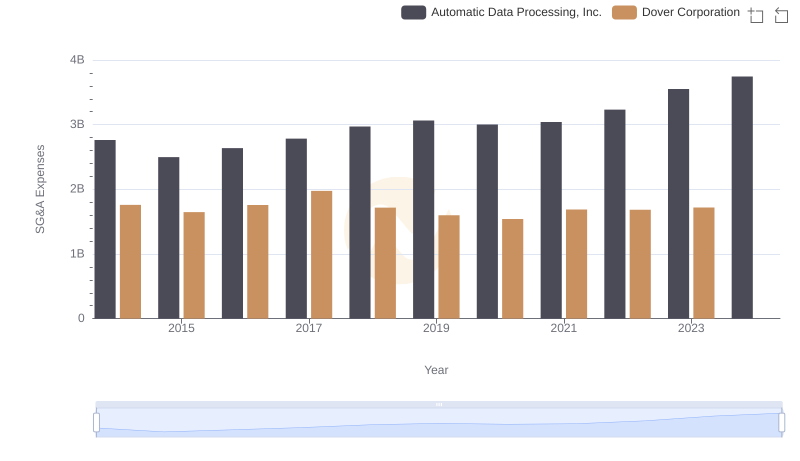
Automatic Data Processing, Inc. and Dover Corporation: SG&A Spending Patterns Compared
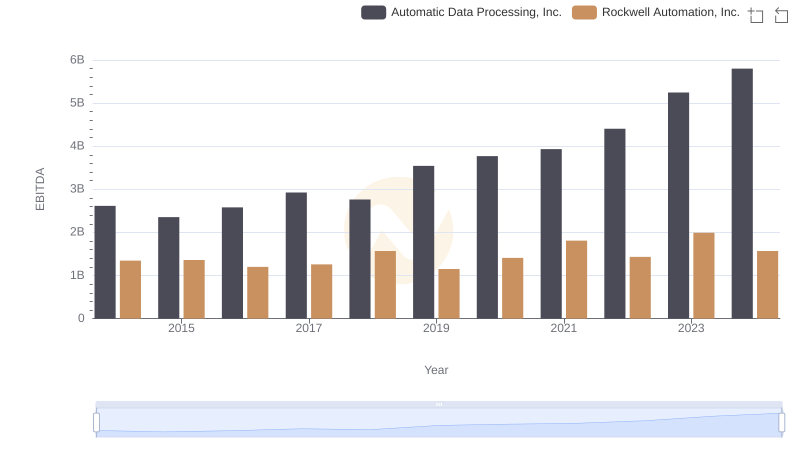
Automatic Data Processing, Inc. and Rockwell Automation, Inc.: A Detailed Examination of EBITDA Performance