| __timestamp | Automatic Data Processing, Inc. | Global Payments Inc. |
|---|---|---|
| Wednesday, January 1, 2014 | 4611400000 | 1751611000 |
| Thursday, January 1, 2015 | 4133200000 | 1750511000 |
| Friday, January 1, 2016 | 4450200000 | 1767444000 |
| Sunday, January 1, 2017 | 4712600000 | 2047126000 |
| Monday, January 1, 2018 | 5016700000 | 2271352000 |
| Tuesday, January 1, 2019 | 5526700000 | 2838089000 |
| Wednesday, January 1, 2020 | 6144700000 | 3772831000 |
| Friday, January 1, 2021 | 6365100000 | 4750037000 |
| Saturday, January 1, 2022 | 7036400000 | 5196898000 |
| Sunday, January 1, 2023 | 8058800000 | 5926898000 |
| Monday, January 1, 2024 | 8725900000 | 6345778000 |
Igniting the spark of knowledge
In the ever-evolving landscape of financial services, Automatic Data Processing, Inc. (ADP) and Global Payments Inc. have showcased intriguing trends in their gross profit margins over the past decade. From 2014 to 2023, ADP's gross profit surged by approximately 89%, reflecting its robust growth and market adaptability. In contrast, Global Payments Inc. experienced a remarkable 238% increase, underscoring its aggressive expansion and strategic acquisitions.
ADP's Steady Climb: Starting at around $4.6 billion in 2014, ADP's gross profit consistently grew, reaching over $8 billion by 2023. This steady rise highlights ADP's resilience and strategic positioning in the market.
Global Payments' Rapid Growth: Despite starting at a lower base of approximately $1.75 billion in 2014, Global Payments Inc. closed 2023 with a gross profit nearing $5.93 billion, showcasing its dynamic growth trajectory.
The data for 2024 remains incomplete, offering a tantalizing glimpse into the future potential of these industry giants.
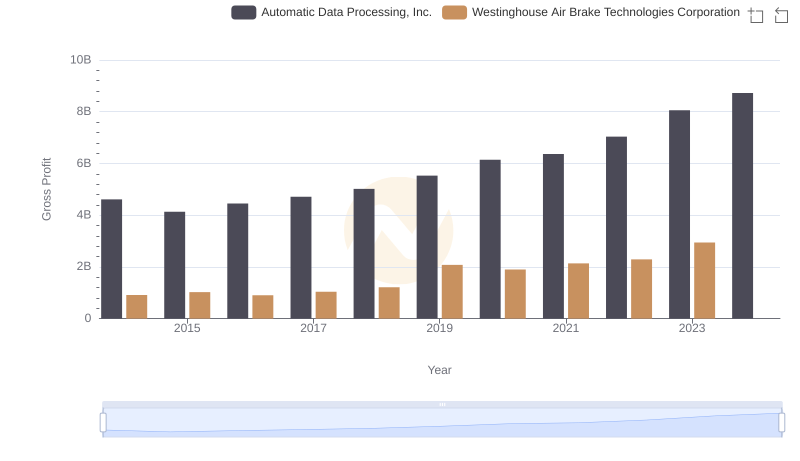
Gross Profit Comparison: Automatic Data Processing, Inc. and Westinghouse Air Brake Technologies Corporation Trends
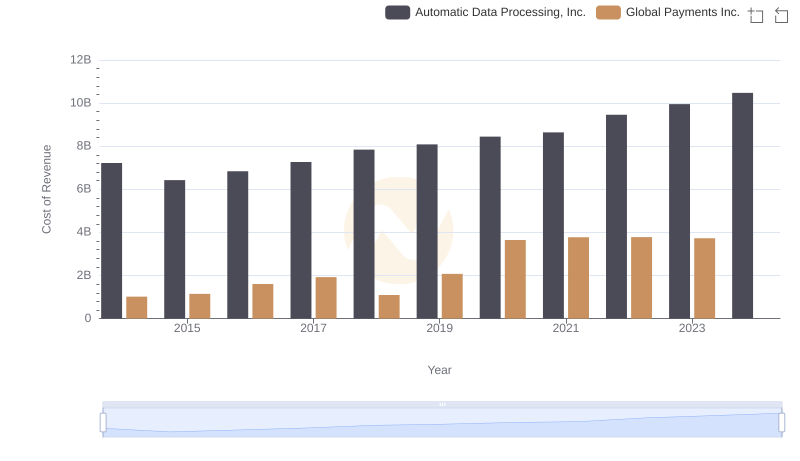
Cost of Revenue: Key Insights for Automatic Data Processing, Inc. and Global Payments Inc.
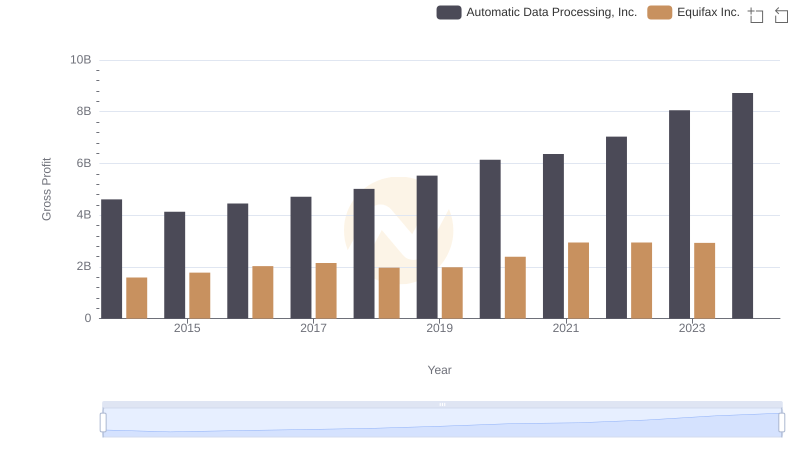
Gross Profit Trends Compared: Automatic Data Processing, Inc. vs Equifax Inc.
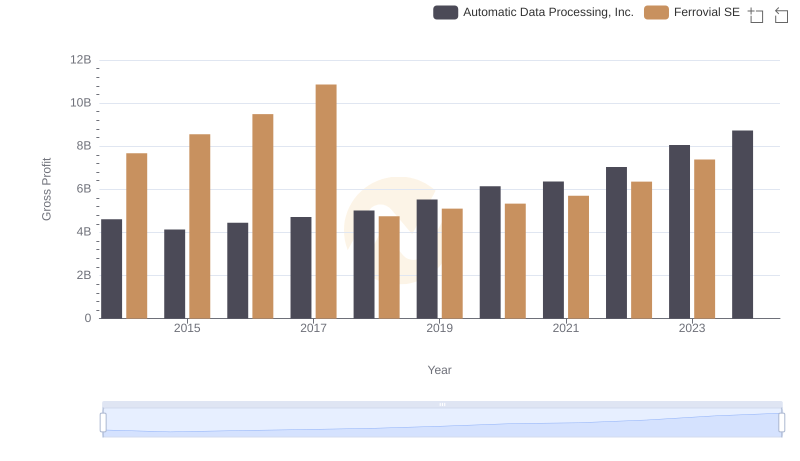
Gross Profit Comparison: Automatic Data Processing, Inc. and Ferrovial SE Trends

Gross Profit Comparison: Automatic Data Processing, Inc. and Dover Corporation Trends
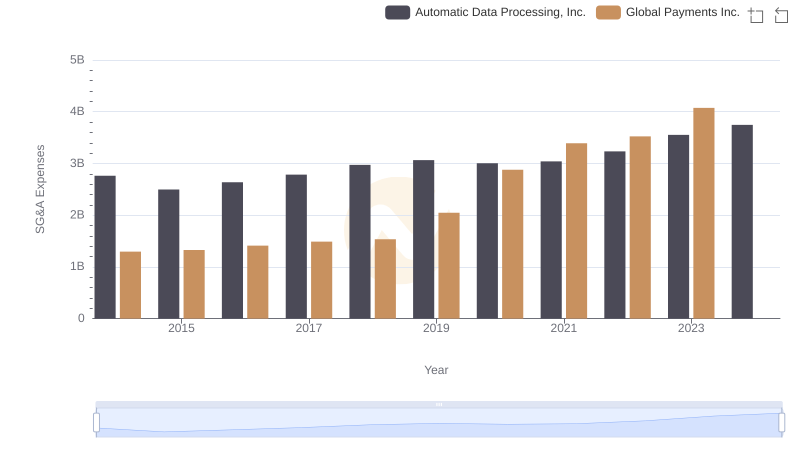
SG&A Efficiency Analysis: Comparing Automatic Data Processing, Inc. and Global Payments Inc.