| __timestamp | Automatic Data Processing, Inc. | Global Payments Inc. |
|---|---|---|
| Wednesday, January 1, 2014 | 7221400000 | 1022107000 |
| Thursday, January 1, 2015 | 6427600000 | 1147639000 |
| Friday, January 1, 2016 | 6840300000 | 1603532000 |
| Sunday, January 1, 2017 | 7269800000 | 1928037000 |
| Monday, January 1, 2018 | 7842600000 | 1095014000 |
| Tuesday, January 1, 2019 | 8086600000 | 2073803000 |
| Wednesday, January 1, 2020 | 8445100000 | 3650727000 |
| Friday, January 1, 2021 | 8640300000 | 3773725000 |
| Saturday, January 1, 2022 | 9461900000 | 3778617000 |
| Sunday, January 1, 2023 | 9953400000 | 3727521000 |
| Monday, January 1, 2024 | 10476700000 | 3760116000 |
Data in motion
In the ever-evolving landscape of financial services, understanding the cost of revenue is crucial for evaluating company performance. Automatic Data Processing, Inc. (ADP) and Global Payments Inc. (GPN) have shown distinct trends over the past decade. From 2014 to 2023, ADP's cost of revenue increased by approximately 45%, reflecting a steady growth trajectory. In contrast, Global Payments Inc. experienced a more volatile pattern, with a notable surge of 270% from 2014 to 2020, followed by stabilization.
ADP's consistent growth suggests robust operational efficiency and market expansion. Meanwhile, GPN's initial rapid increase could indicate strategic investments or acquisitions, stabilizing in recent years. The absence of data for 2024 for GPN highlights potential reporting delays or strategic shifts. These insights provide a window into the financial health and strategic directions of these industry giants.

Comparing Cost of Revenue Efficiency: Automatic Data Processing, Inc. vs Rockwell Automation, Inc.
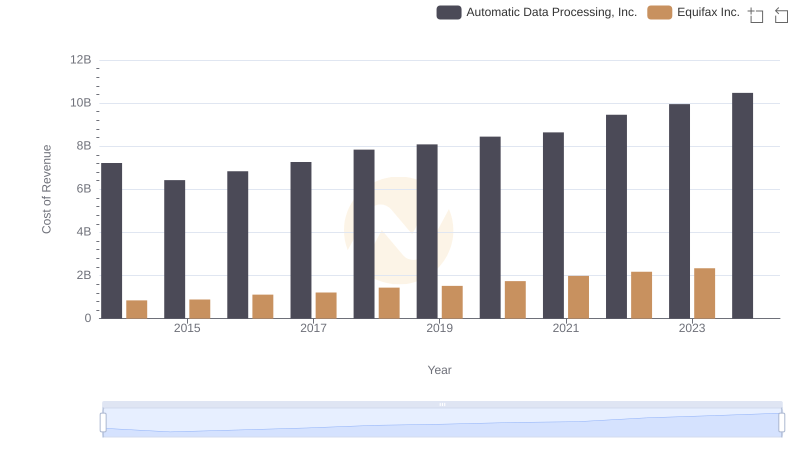
Cost of Revenue: Key Insights for Automatic Data Processing, Inc. and Equifax Inc.
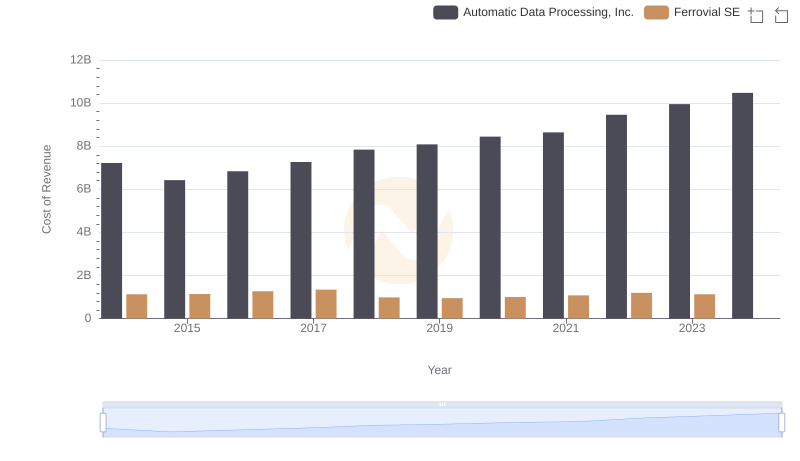
Cost of Revenue Comparison: Automatic Data Processing, Inc. vs Ferrovial SE
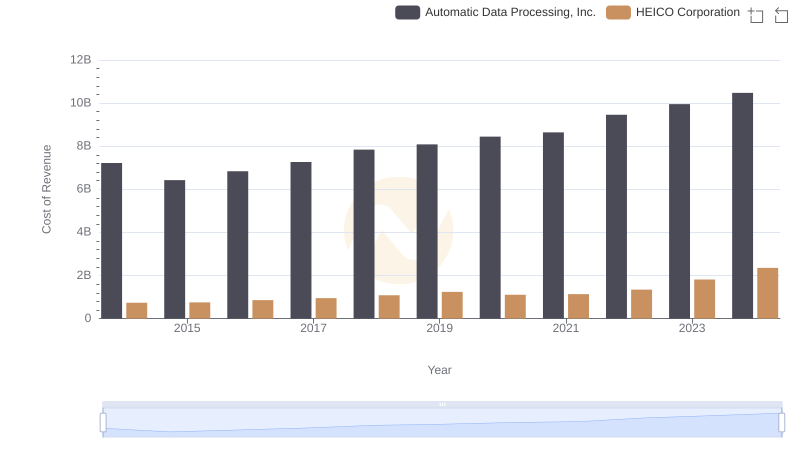
Analyzing Cost of Revenue: Automatic Data Processing, Inc. and HEICO Corporation
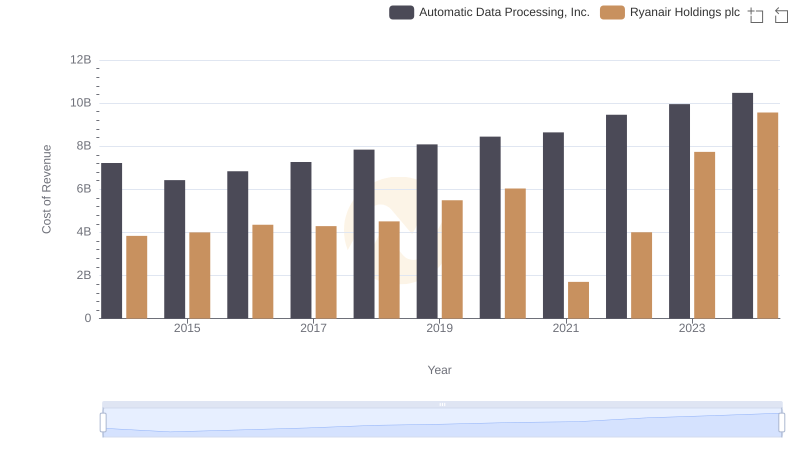
Cost of Revenue Trends: Automatic Data Processing, Inc. vs Ryanair Holdings plc
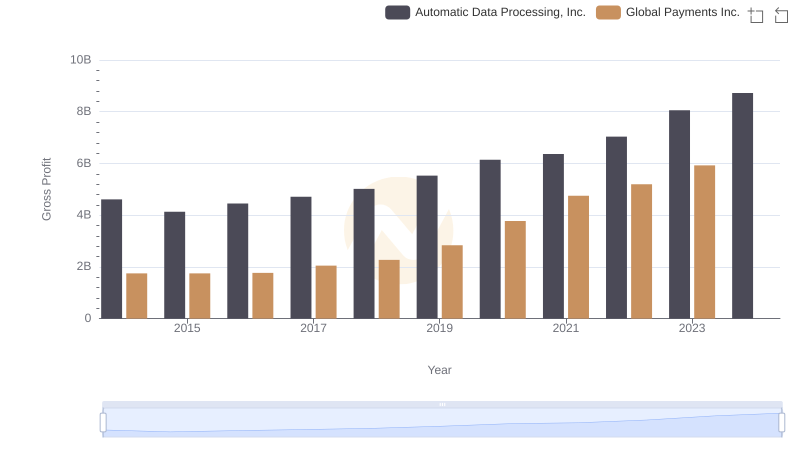
Automatic Data Processing, Inc. and Global Payments Inc.: A Detailed Gross Profit Analysis
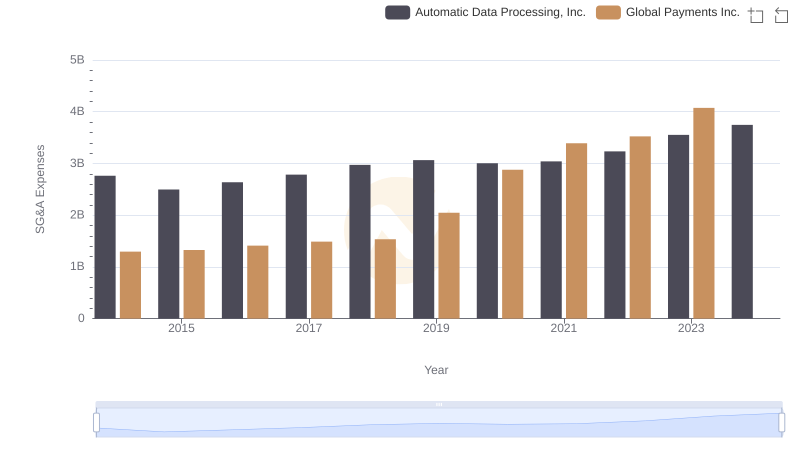
SG&A Efficiency Analysis: Comparing Automatic Data Processing, Inc. and Global Payments Inc.